

A high-field curve labeled flux density does not directly give saturation polarization. In SI notation, B = mu0 H + J, where B is magnetic flux density in teslas, H is magnetic field strength in amperes per metre, mu0 is the vacuum permeability, and J is magnetic polarization in teslas.
The applied-field contribution mu0 H continues increasing with H. Even when polarization approaches a limiting value, B does not become a perfectly horizontal curve. A model fitted to the wrong quantity can therefore assign an incorrect high-field behavior.
Retain what was measured at each temperature
Identify the steel, orientation, mechanical condition and magnetic history. Record actual specimen temperature and whether it is uniform and stable over the useful measurement region. A chamber setting is insufficient where excitation or thermal lag changes the specimen condition.
Use measured H and B with the test’s justified internal-field treatment. Finite specimen shape and the magnetic circuit can affect how applied and internal fields relate. State that treatment before extracting J or fitting a high-field curve.
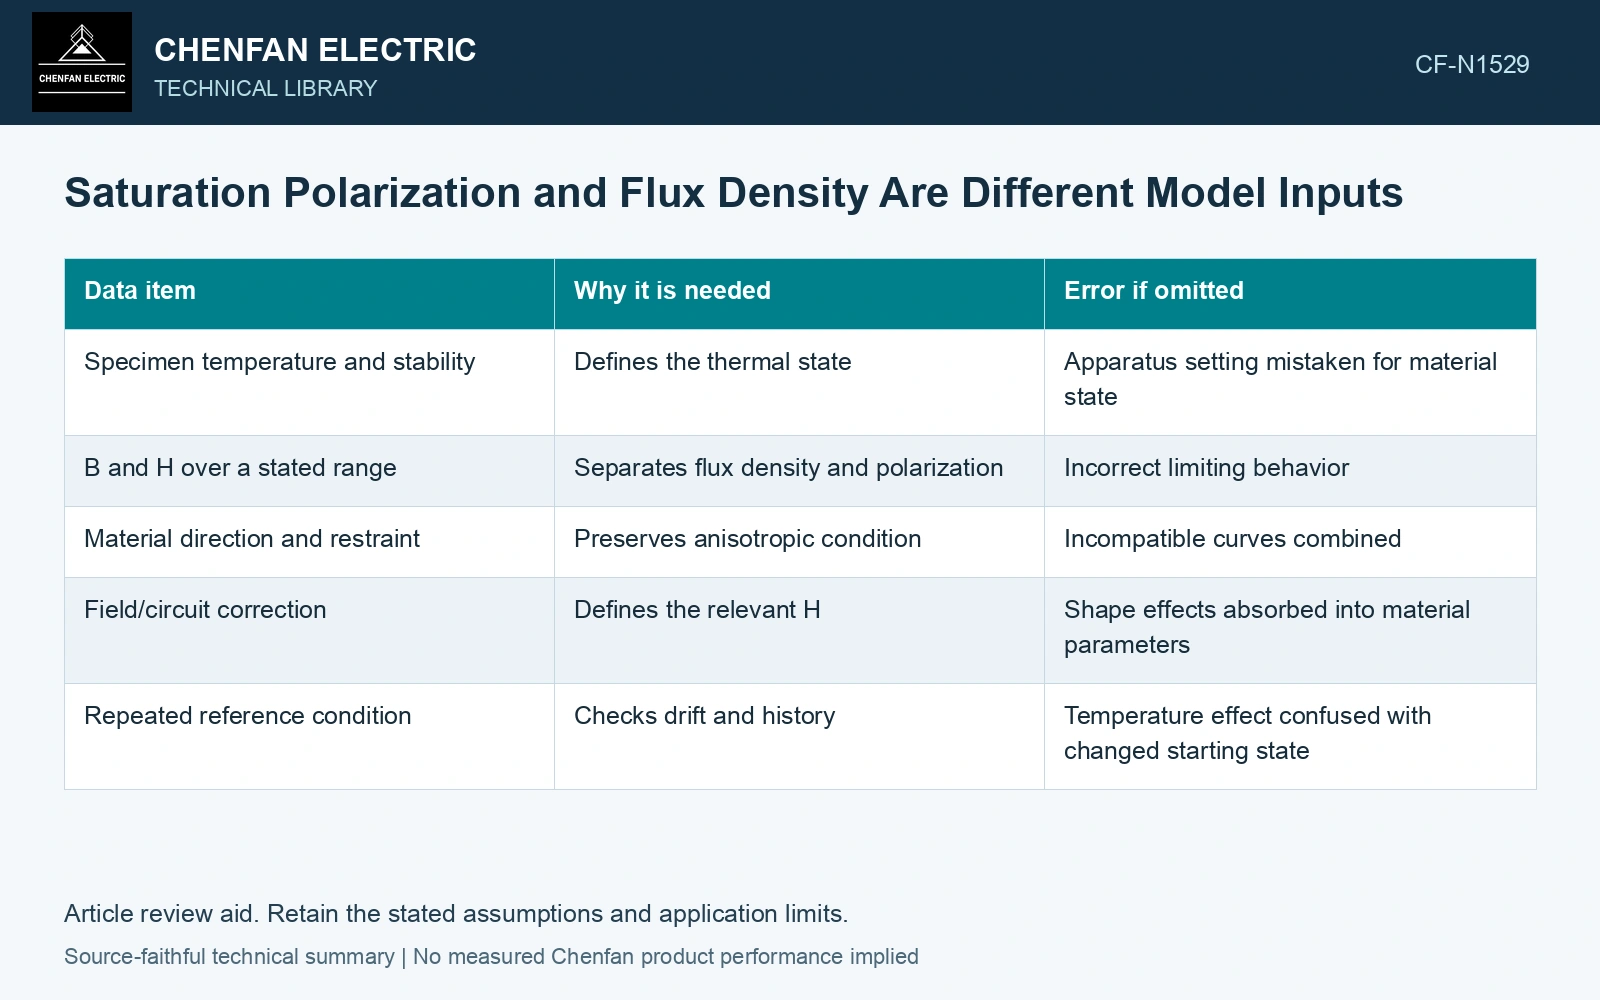
| Data item | Why it is needed | Error if omitted |
|---|---|---|
| Specimen temperature and stability | Defines the thermal state | Apparatus setting mistaken for material state |
| B and H over a stated range | Separates flux density and polarization | Incorrect limiting behavior |
| Material direction and restraint | Preserves anisotropic condition | Incompatible curves combined |
| Field/circuit correction | Defines the relevant H | Shape effects absorbed into material parameters |
| Repeated reference condition | Checks drift and history | Temperature effect confused with changed starting state |
The resulting data table should preserve the measured range and uncertainty rather than only a fitted saturation parameter.
Fit within demonstrated behavior
At each temperature, examine whether the highest measured field is sufficient to identify the intended parameter. A fitted asymptote can be weakly constrained if all measurements remain far from it. Report that limitation and test sensitivity to the fitting range.
Do not force temperature curves into a shared form solely to simplify software input. A parameter that changes dramatically when the upper data range is trimmed may be describing extrapolation rather than a well-established material property.
Keep operating design separate from Curie temperature
Curie temperature describes a fundamental transition, not the acceptable operating flux density of a finished transformer. Design limits also involve excitation response, loss, heating, voltage-frequency duty and the complete magnetic circuit. A material far below its Curie point can still operate in a region unsuitable for the application.
Validate interpolation at temperature and field conditions not used in the fit where the model will be relied upon. Clearly mark predictions beyond the measured temperature or high-field range. Near saturation, small modeling differences can produce substantial changes in predicted excitation behavior.
The engineering output is a temperature-indexed material dataset with defined B, H and J conventions. It gives the designer a traceable high-field representation and a visible extrapolation boundary, rather than one unqualified saturation number copied between temperature conditions.
Technical references
- Materials / MDPI. Magnetostrictive Properties of the Grain-Oriented Silicon Steel Sheet under DC-Biased and Multisinusoidal Magnetizations.
- NIST. NCAL: Diffraction Stress Measurement Under Applied Load.