

Transformer paper need not have uniform moisture. Temperature history, drying access and migration can leave different regions in different states. A uniform dielectric fit compresses that distribution into an equivalent response. Its result cannot automatically be treated as the highest local moisture. [1]
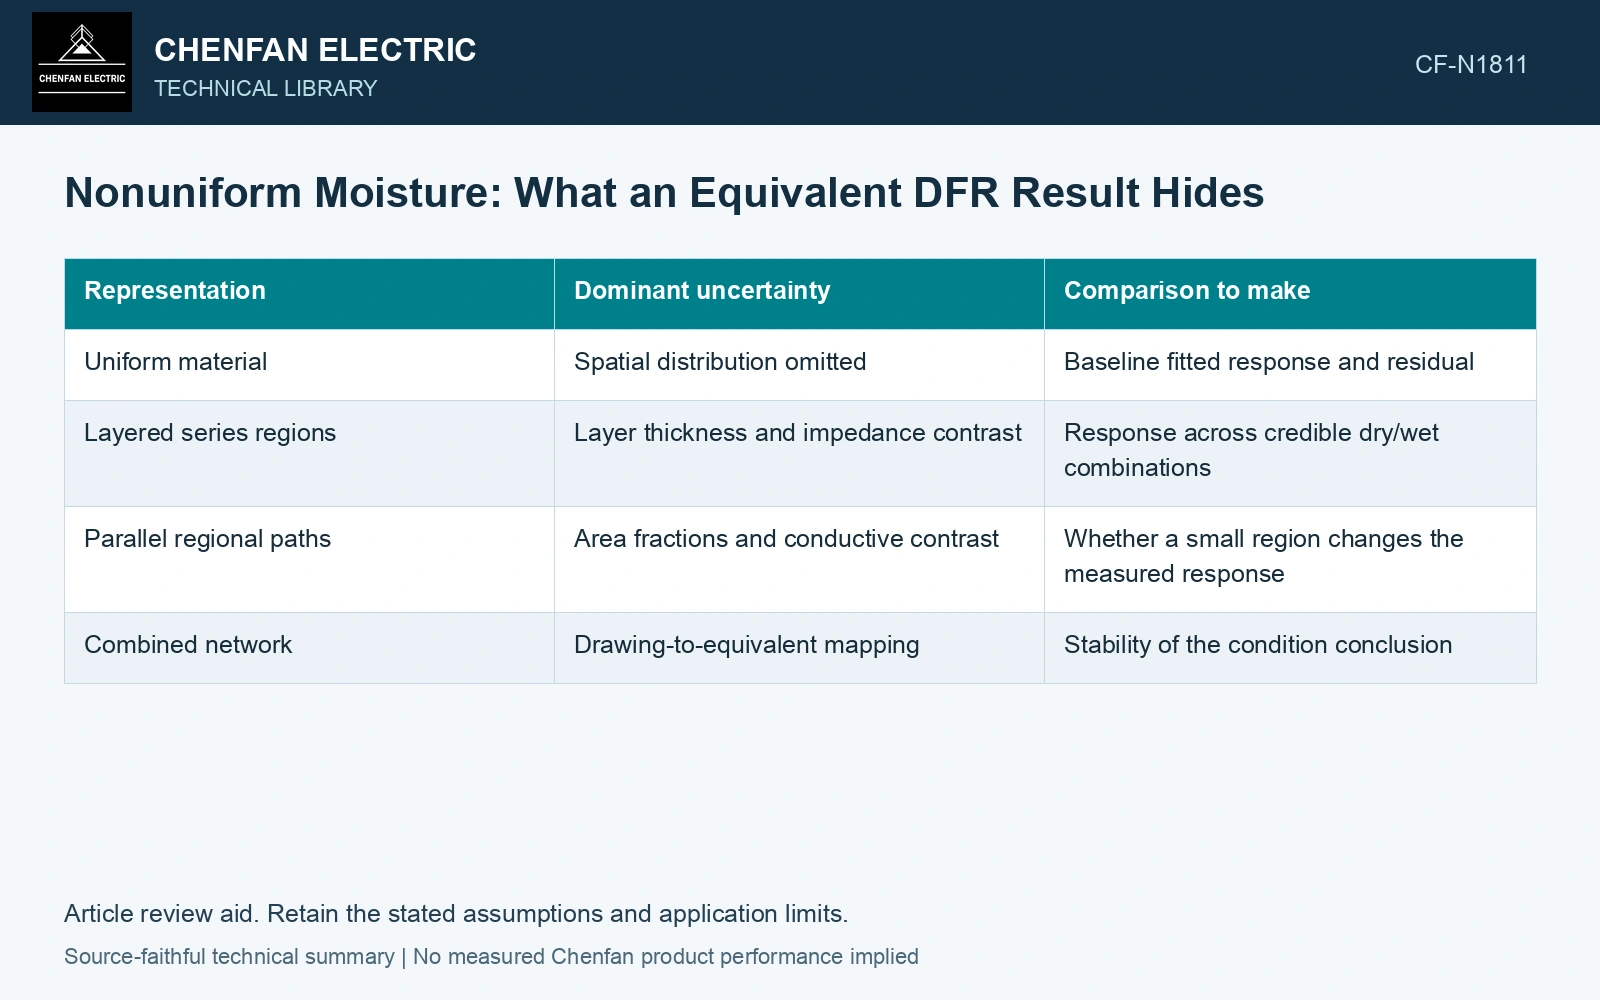
Make the electrical arrangement explicit
For an illustrative series path, region impedances add: Z = Z₁ + Z₂. For parallel paths, admittances add: Y = Y₁ + Y₂. Z is impedance in ohms and Y is admittance in siemens at the stated frequency. Each region’s complex response includes material, geometry and temperature. These relations describe ideal circuit arrangements, not a complete transformer insulation model.
| Representation | Dominant uncertainty | Comparison to make |
|---|---|---|
| Uniform material | Spatial distribution omitted | Baseline fitted response and residual |
| Layered series regions | Layer thickness and impedance contrast | Response across credible dry/wet combinations |
| Parallel regional paths | Area fractions and conductive contrast | Whether a small region changes the measured response |
| Combined network | Drawing-to-equivalent mapping | Stability of the condition conclusion |
Compare profiles that the measurement can distinguish
Construct physically justified profiles from the winding geometry and known processing history. Do not introduce arbitrary wet layers merely to improve the fit. Hold temperature and oil assumptions consistently while comparing the resulting spectra.
A small wet region may have weak influence on one measured boundary or substantial influence on another. Its effect depends on placement and impedance contrast, not only its share of paper mass. A bulk equivalent therefore is neither a simple arithmetic moisture average nor a guaranteed local maximum.
Water in oil and water in cellulose are different material inventories; temperature, distribution and sampling determine whether one observation represents another region. [2]
Show what a bulk mass average can conceal
Assumptions at 20 °C: equal dry masses of two paper regions contain 1% and 3% water, giving bulk water 2% by dry mass. Independently assumed conductivities are σ₁ = 10⁻¹³ S/m and σ₂ = 10⁻¹¹ S/m; both have ε = 3ε₀, with ε₀ ≈ 8.85419×10⁻¹² F/m. These conductivities are assigned model inputs, not a validated water calibration. At 0.01 Hz, set γk = σk + j2πfε. Equal-thickness series regions give γs = 2/(1/γ₁ + 1/γ₂), while equal-area parallel regions give γp = (γ₁ + γ₂)/2. Tanδ = Re(γ)/Im(γ) is 0.21697 in series and 3.02581 in parallel despite the same 2% water inventory. Therefore retain topology and regional ambiguity; neither uniform fit nor mass average establishes the 3% local maximum. [1][2]
References
- IEEE, IEEE C57.161-2018, IEEE Guide for Dielectric Frequency Response Test.
- S. R. Arsad et al., Water Content in Transformer Insulation System: A Review on the Detection and Quantification Methods, Energies 16, 1920, 2023. DOI: 10.3390/en16041920.