

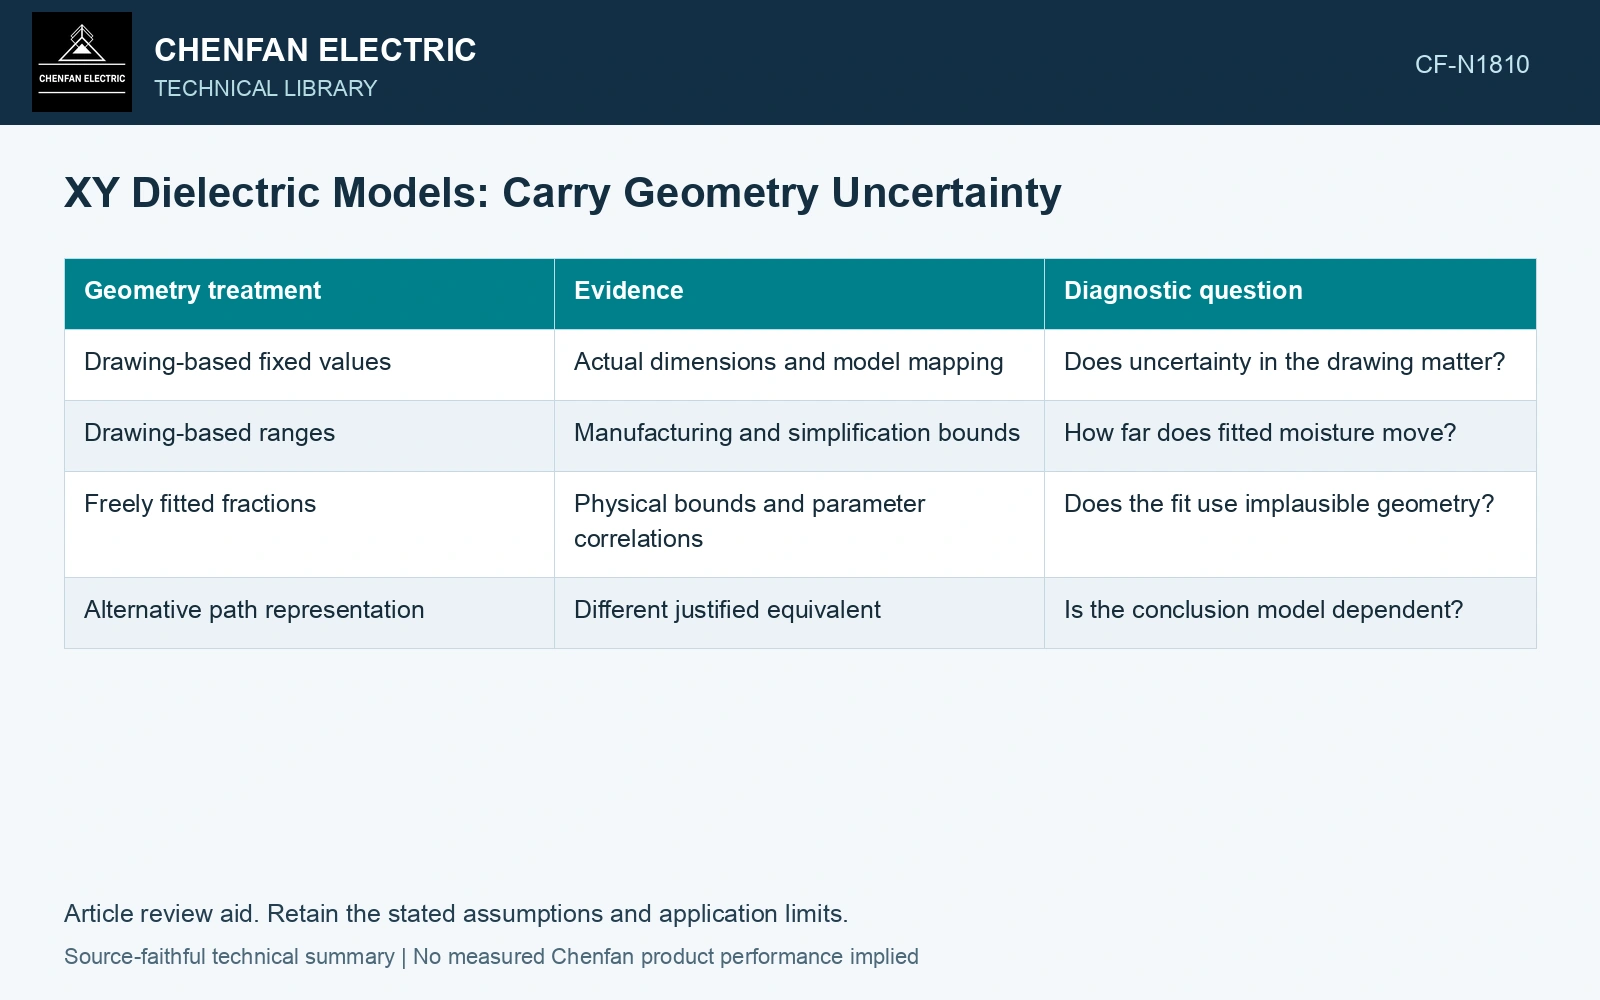
An XY oil-paper fit can trade geometry against material response. Obtain the software’s actual definitions before transferring X or Y from another library. Arsad and co-authors describe barrier/spacer geometry and the temperature, water and oil-conductivity database used in this fitting process. [1][2]
Define the paths before assigning fractions
For this illustrative two-path model, X is the paper thickness fraction of a series paper/oil path; Y is the area fraction of a separate all-paper spacer path in parallel. With complex conductivities γp and γo, γeff = Yγp + (1 − Y)/(X/γp + (1 − X)/γo). This defines our model explicitly; another implementation’s X/Y cannot be substituted by name.
Refit one controlled loss-factor point
Model assumptions: temperature is 20 °C, f = 0.1 Hz, Y = 0.10, ε₀ ≈ 8.85419×10⁻¹² F/m, γo = 10⁻¹² + j2πf(2.2ε₀) S/m, and γp(m) = 10⁻¹³e²ᵐ + j2πf(4ε₀) S/m. Here m is the numerical dry-mass water percentage; this assumed calibration is not a material dataset.
Assume the observed tanδ is 0.1270997. Solve Re(γeff)/Im(γeff) = 0.1270997 for m. At X = 0.20, bisection gives m = 2.03283%; at X = 0.30 it gives 1.96893%. Both reproduce that loss factor, leaving a geometry-induced span of 0.06390 percentage point. A loss-only residual cannot choose which geometry or moisture is present.
Use capacitance to challenge the same fit
The two solutions predict Re(εeff*)/ε₀ = Im(γeff)/(2πfε₀) of 2.58293 and 2.69654. If the independently observed effective relative permittivity is assumed to be 2.64 with an accepted ±0.02 interval, both endpoint fits fail this second observable. X = 0.25 and m = 2.00000% instead give 2.63845 and the same tanδ. Retain the joint capacitance/loss constraint and drawing bounds before issuing a moisture estimate; this one-frequency demonstration does not validate a full transformer model. [1][2]
References
- IEEE, IEEE C57.161-2018, IEEE Guide for Dielectric Frequency Response Test.
- S. R. Arsad et al., Water Content in Transformer Insulation System: A Review on the Detection and Quantification Methods, Energies 16, 1920, 2023. DOI: 10.3390/en16041920.