

Core support blocks replace an exposed oil-cooled surface with a contact heat path. Evaluate that path, its far-end temperature and the covered region to identify a hidden hot spot. [1] [2]
The exposed steel beside the block may be cool while the covered region is hotter. Its temperature cannot rule out a hidden hot spot without a validated relation between the two.
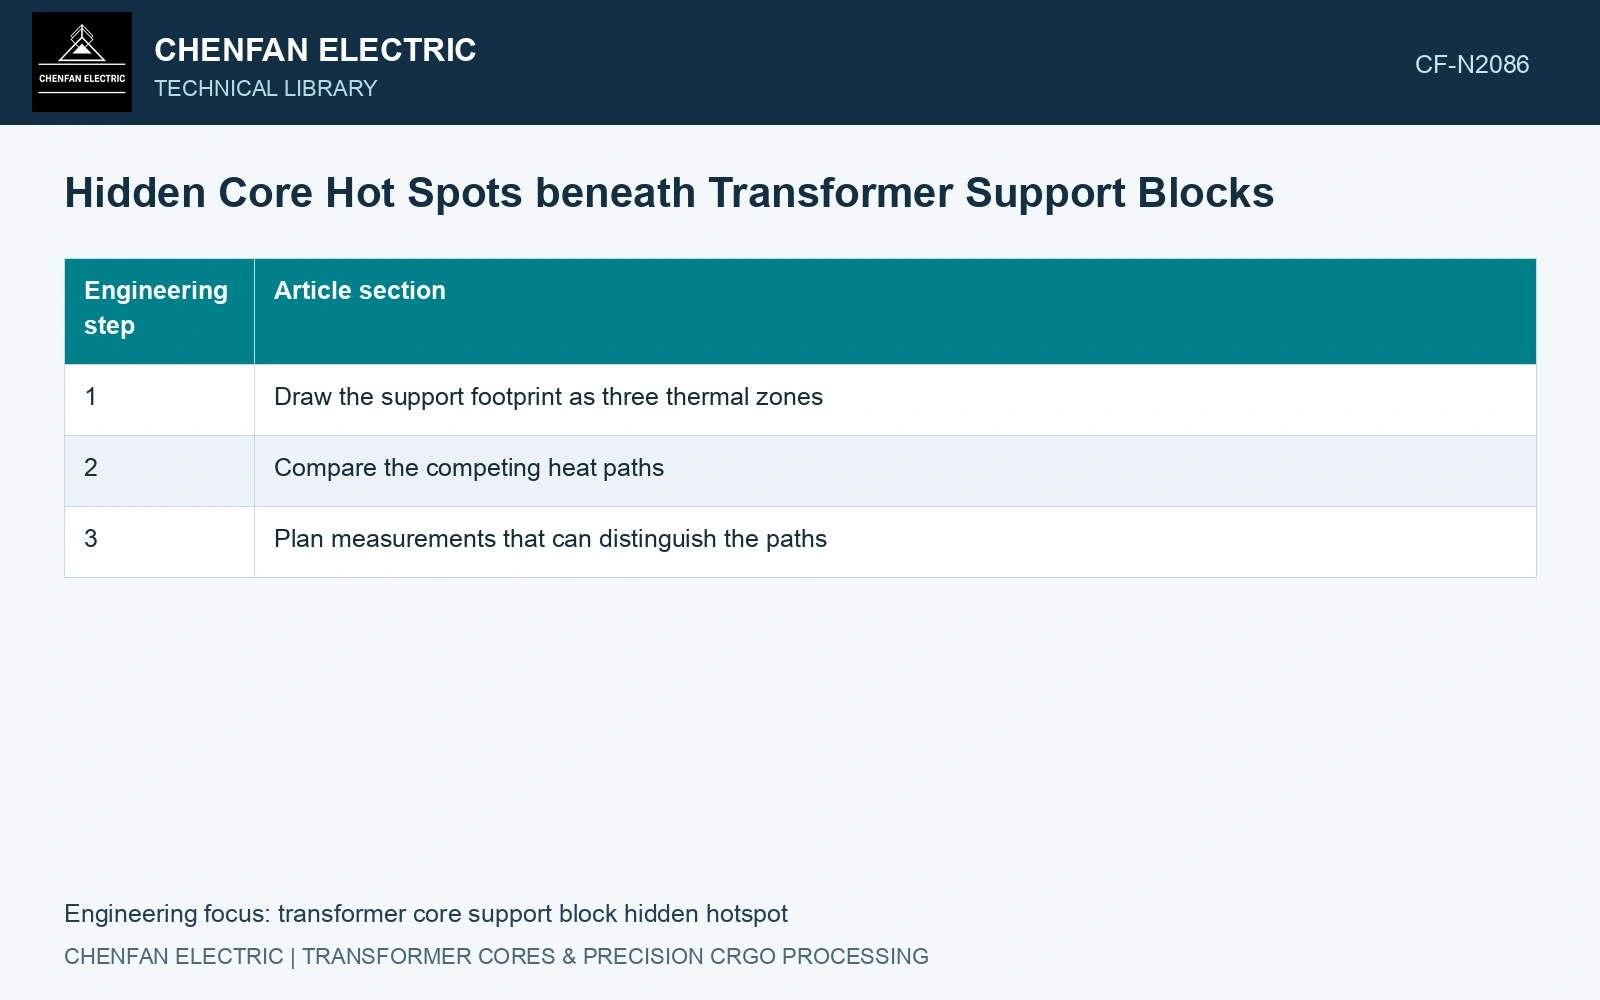
Draw the support footprint as three thermal zones
- Covered steel: mark the footprint, local loss source and any duct opening that the block overlaps.
- Support and receiving structure: mark the actual contacts, block thickness, directional material properties and the temperature boundary beyond it.
- Exposed neighbourhood: mark oil access, bypass gaps, packet ends and the locations available for comparison measurements.
Include tolerances that change the footprint or contact. A slightly displaced block can cover a duct entrance while leaving nearly the same total exposed steel area. That is a flow-path change, not merely an area correction.
Compare the competing heat paths
Separate interface contact resistance from conduction through the block. Perfect-contact modelling can overstate cooling if a real insulating sheet, gap or uneven pressure sits between steel and support. Setting the entire covered surface to thermal insulation can be unnecessarily pessimistic if a substantial contact path exists.
For the neighbouring oil, determine whether the support creates a sheltered pocket or a bypass. Do not reuse the exposed-region heat-transfer coefficient underneath the block. Evaluate this construction’s local flow, support contact and sensor-hosting paths separately.
Compare plausible contact and flow scenarios while keeping the same local heat input. Identify the hidden region whose predicted temperature is most sensitive to the uncertain path.
Plan measurements that can distinguish the paths
Provide approved sensor positions during design or assembly where possible. A measurement near the steel–support interface answers a different question from a probe on the block’s outer face. Record that distinction and the thermal influence of the sensor installation.
Use an exposed steel point, a support point and local fluid temperature as complementary evidence. Their time histories may help test the proposed heat paths, but they do not uniquely reconstruct the covered temperature without a model and known sensor response.
Assume 50 kg of 23ZH90: its 0.90 W/kg strip budget at 1.7 T, 50 Hz is 45 W [3]. Assume parallel exposed and support paths of 2.0 and 0.5 W/K to one boundary: rise is 18 K. Halving the exposed conductance to 1.0 W/K raises it to 30 K. With that blockage still present, doubling support conductance to 1.0 W/K gives 22.5 K. Against an assumed 20 K review gate, neither blocked arrangement passes. Redesign the footprint or demonstrate another adequate heat path; the temperature on the support’s accessible face cannot by itself distinguish these mechanisms.
Support position, packet compression, contact material and as-built coverage determine the parallel paths. Inspect those features at the sheltered region rather than assigning one contact conductance to the entire frame.
Validate covered zones with representative construction and planned instrumentation. Report tested regions and unresolved measurement coverage separately, with the assumptions bounding inaccessible locations.
References
- Z. Chen, Z. He and S. Wang, Transformer Iron Core Temperature Field Calculation Based on Finite Element Analysis, Energies 18, 6537, 2025. DOI: 10.3390/en18246537.
- U.S. Department of Energy, DOE-HDBK-1012/2-92, Thermodynamics, Heat Transfer, and Fluid Flow, Volume 2, 1992.
- Nippon Steel Corporation, Grain-Oriented Electrical Steel Sheets, catalogue D004je, April 2020, specification and typical-property tables.