

A thermal inverse model should show which core-source regions the measurements distinguish. Test alternative distributions against the same temperatures to identify where another sensor or material test adds decisive evidence. [1] [2]
Ask which regions the sensors can distinguish before fitting a finely divided source map. A precise-looking inverse result can simply reflect the chosen regularization or initial guess.
Test the source-to-sensor sensitivity
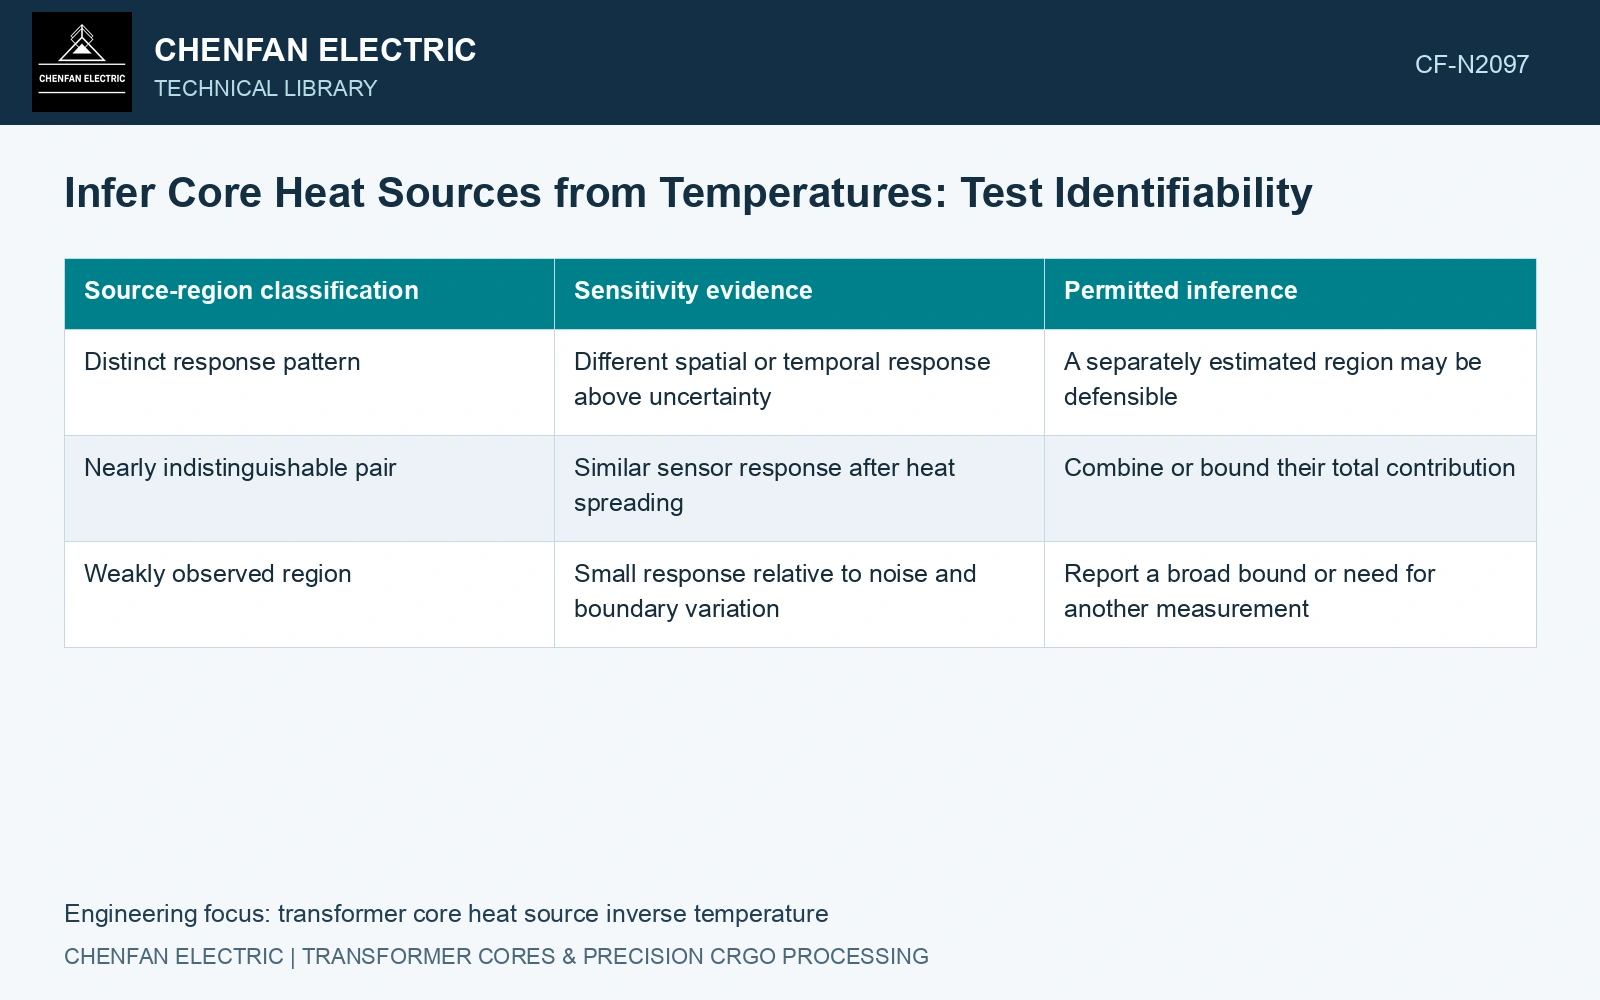
For each proposed source region, perturb its heat input in the verified forward model and record the change in every sensor trace. Compare the resulting response patterns. Regions with nearly proportional patterns are difficult to separate, even if the readings themselves are repeatable.
For the independent example below, assume a steady-state linear sensor model θ₁ = 0.1(Q₁ + Q₂) and θ₂ = 0.2(Q₁ + Q₂), with Q in watts and θ in kelvin. Its two rows are proportional; the numerical case tests what can actually be identified.
| Source-region classification | Sensitivity evidence | Permitted inference |
|---|---|---|
| Distinct response pattern | Different spatial or temporal response above uncertainty | A separately estimated region may be defensible |
| Nearly indistinguishable pair | Similar sensor response after heat spreading | Combine or bound their total contribution |
| Weakly observed region | Small response relative to noise and boundary variation | Report a broad bound or need for another measurement |
Time traces can add information if the regions have different response shapes. More time samples do not resolve the example if the entire transient responses remain proportional.
Constrain the boundaries independently
Record local fluid temperatures, cooling state, support contacts and sensor response. A warmer boundary or higher contact resistance can mimic extra source power. Fitting all of them freely may allow the model to explain the same trace in many ways.
Use defensible prior bounds for properties and source regions, stating their origin. A smoothing penalty can favour a broad source; a sparse penalty can favour a concentrated source. Neither makes its preferred pattern a measured defect.
Validate the model against independent observations
Check another sensor location or controlled duty history withheld from fitting. Compare credible alternative source maps, not only the best-fit residual. If they predict the independent evidence equally well, retain the ambiguity.
Anchor the total source screen to 23ZH90’s catalogue maximum of 0.90 W/kg at 1.7 T, 50 Hz. [3] An assumed 100 kg represented strip inventory gives 90 W. In the stated two-sensor model, either (Q₁,Q₂) = (20,70) W or (60,30) W therefore predicts (9,18) K. The source-to-sensor matrix has determinant 0.1 × 0.2 − 0.1 × 0.2 = 0, so a unique regional split cannot be recovered. Add a sensor with independently validated, non-proportional sensitivity or report only a bounded total; increasing the number of samples at the existing locations does not repair this rank deficiency.
Keep cut quality, joint overlap and compression as separately recorded candidate mechanisms. A fitted temperature map cannot identify which manufacturing parameter changed when their sensor responses are indistinguishable.
Report distinguishable source regions and unresolved combinations. Add mechanism-specific evidence when the decision requires locating an individual manufacturing defect.
References
- Z. Chen, Z. He and S. Wang, Transformer Iron Core Temperature Field Calculation Based on Finite Element Analysis, Energies 18, 6537, 2025. DOI: 10.3390/en18246537.
- U.S. Department of Energy, DOE-HDBK-1012/2-92, Thermodynamics, Heat Transfer, and Fluid Flow, Volume 2, 1992.
- Nippon Steel Corporation, Grain-Oriented Electrical Steel Sheets, catalogue D004je, April 2020, specification and typical-property tables.