

An SST achieves its best efficiency at one active-power point. The site may spend much of the year lightly loaded while requesting reactive support. That operation can increase current and losses without increasing the active power delivered to the load. One peak percentage cannot describe it.
Specify the complete measurement boundary first: input and output ports, auxiliary supplies and cooling power included. Then map loss across the operating points the application actually uses.
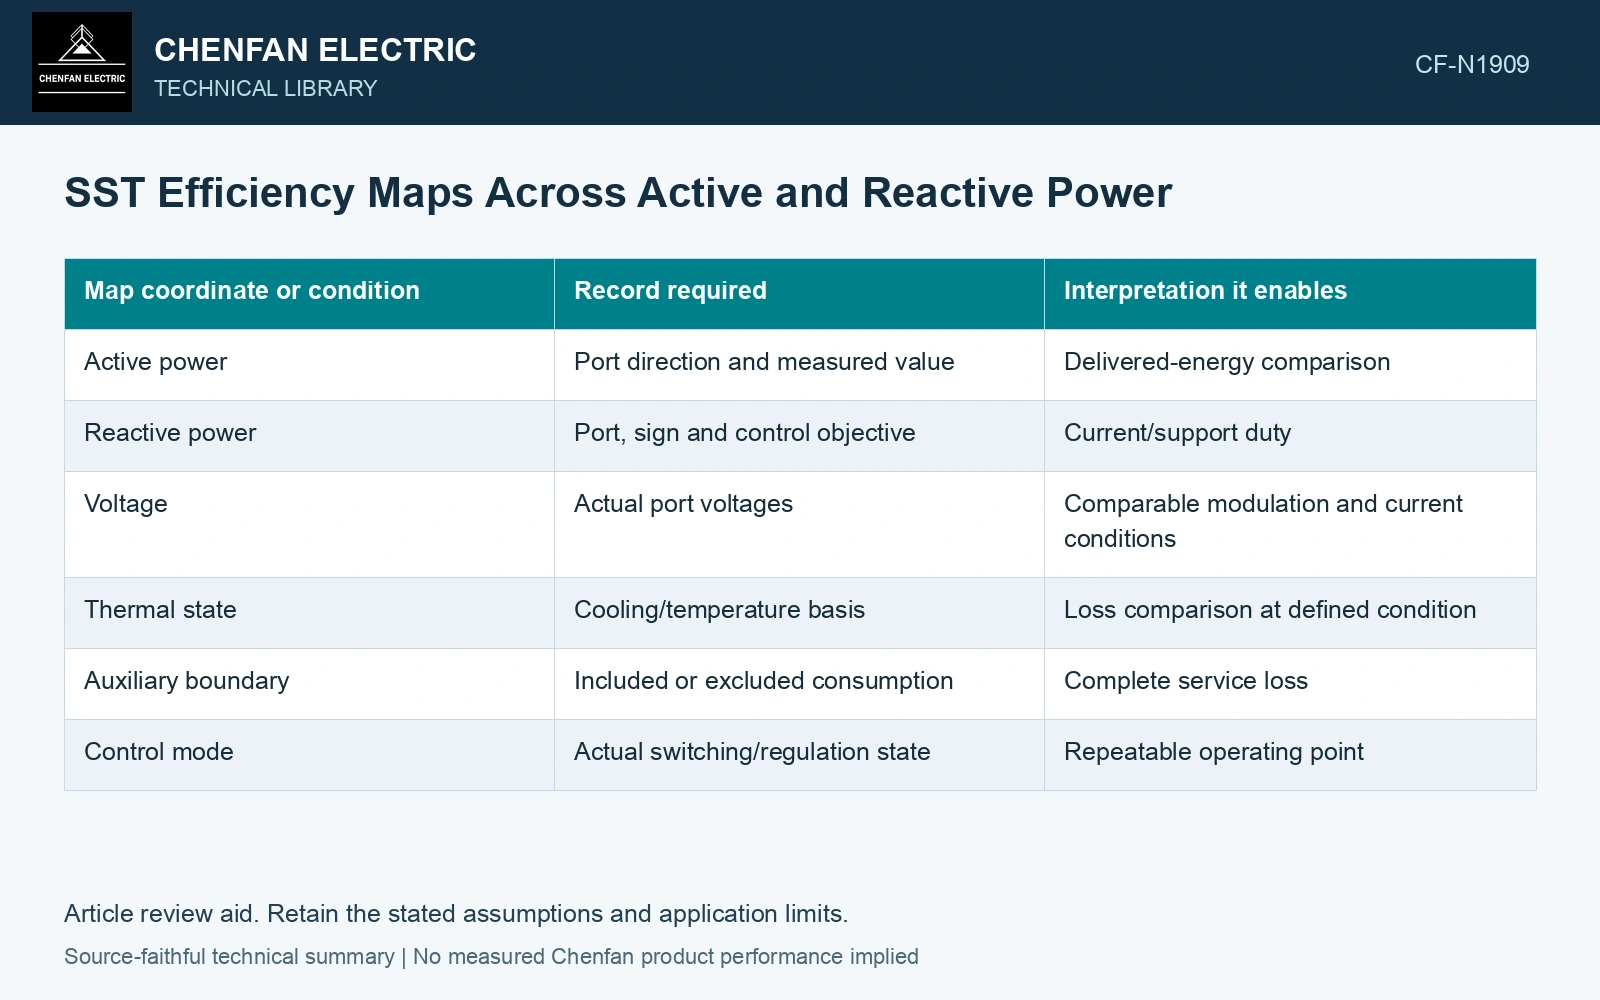
Retain active and reactive conditions
| Map coordinate or condition | Record required | Interpretation it enables |
|---|---|---|
| Active power | Port direction and measured value | Delivered-energy comparison |
| Reactive power | Port, sign and control objective | Current/support duty |
| Voltage | Actual port voltages | Comparable modulation and current conditions |
| Thermal state | Cooling/temperature basis | Loss comparison at defined condition |
| Auxiliary boundary | Included or excluded consumption | Complete service loss |
| Control mode | Actual switching/regulation state | Repeatable operating point |
Different ports can have different reactive duties. Do not assume output Q transfers unchanged to the input in a controlled multi-stage system.
Use apparent power as a bounded illustration
For a balanced sinusoidal fundamental at one three-phase port, apparent power magnitude is S = sqrt(P² + Q²). S is in volt-amperes, P in watts and Q in vars. At fixed voltage, increasing S generally requires greater current. The actual loss change depends on hardware, waveform and control.
This relation does not account for all harmonic or unbalanced effects. A measurement map should retain those conditions where relevant, rather than force them into an ideal P–Q picture.
Prefer loss near zero active power
At zero delivered active power with positive idle input, the output-to-input active-power ratio is zero; if both quantities are zero, the ratio is undefined. Near zero transfer, report loss in watts and reactive capability because the ratio alone gives a poor account of the service. A poor-looking ratio can reflect a small denominator, while a high ratio can exclude auxiliary consumption.
Huber and Kolar discuss added conversion-stage losses at the complete AC-to-AC boundary [1]. Measure equivalent service ports and auxiliary demand before applying the three-phase P–Q/current relation [2] to any loss model.
Weight the map with real duty
For discrete operating intervals, annual loss energy can be estimated as sum of P_loss,k times interval tk, using watts and hours to obtain watt-hours. The loading and reactive schedule must be credible. A single maximum-efficiency point cannot replace that distribution.
Assume balanced 400 V output at P=100 kW. Q=0/75 kvar gives S=100/125 kVA and currents 144.34/180.42 A [2]. For a fictional loss model with 2 kW fixed/auxiliary plus 1 kW resistive loss at the first current, total loss becomes 3/3.5625 kW; efficiencies are 97.09%/96.56%. Assume 4,000/2,000 h at these states: annual loss is 19.125 MWh versus 18 MWh if Q is ignored, understating loss by 1.125 MWh. Use measured P–Q loss maps and actual hours for purchase decisions; this I² model does not represent all switching or temperature losses.
The purchasing comparison should show loss at representative active/reactive states, with the same auxiliary boundary and service functions. It lets the owner see the energy consequence of the support duty being requested. Efficiency then becomes a measured operating result rather than an isolated number detached from how the SST will be used.
References
- J. E. Huber and J. W. Kolar, Solid-State Transformers: On the Origins and Evolution of Key Concepts, IEEE Industrial Electronics Magazine 10(3), 2016. DOI: 10.1109/MIE.2016.2588878.
- U.S. Department of Energy, DOE-HDBK-1011/4-92, Electrical Science, Volume 4, 1992.