

A two-dimensional coil map makes GOES laser-refinement uniformity visible across width and production time. Register samples around edge bands and process interruptions to connect acceptance evidence with delivered material.
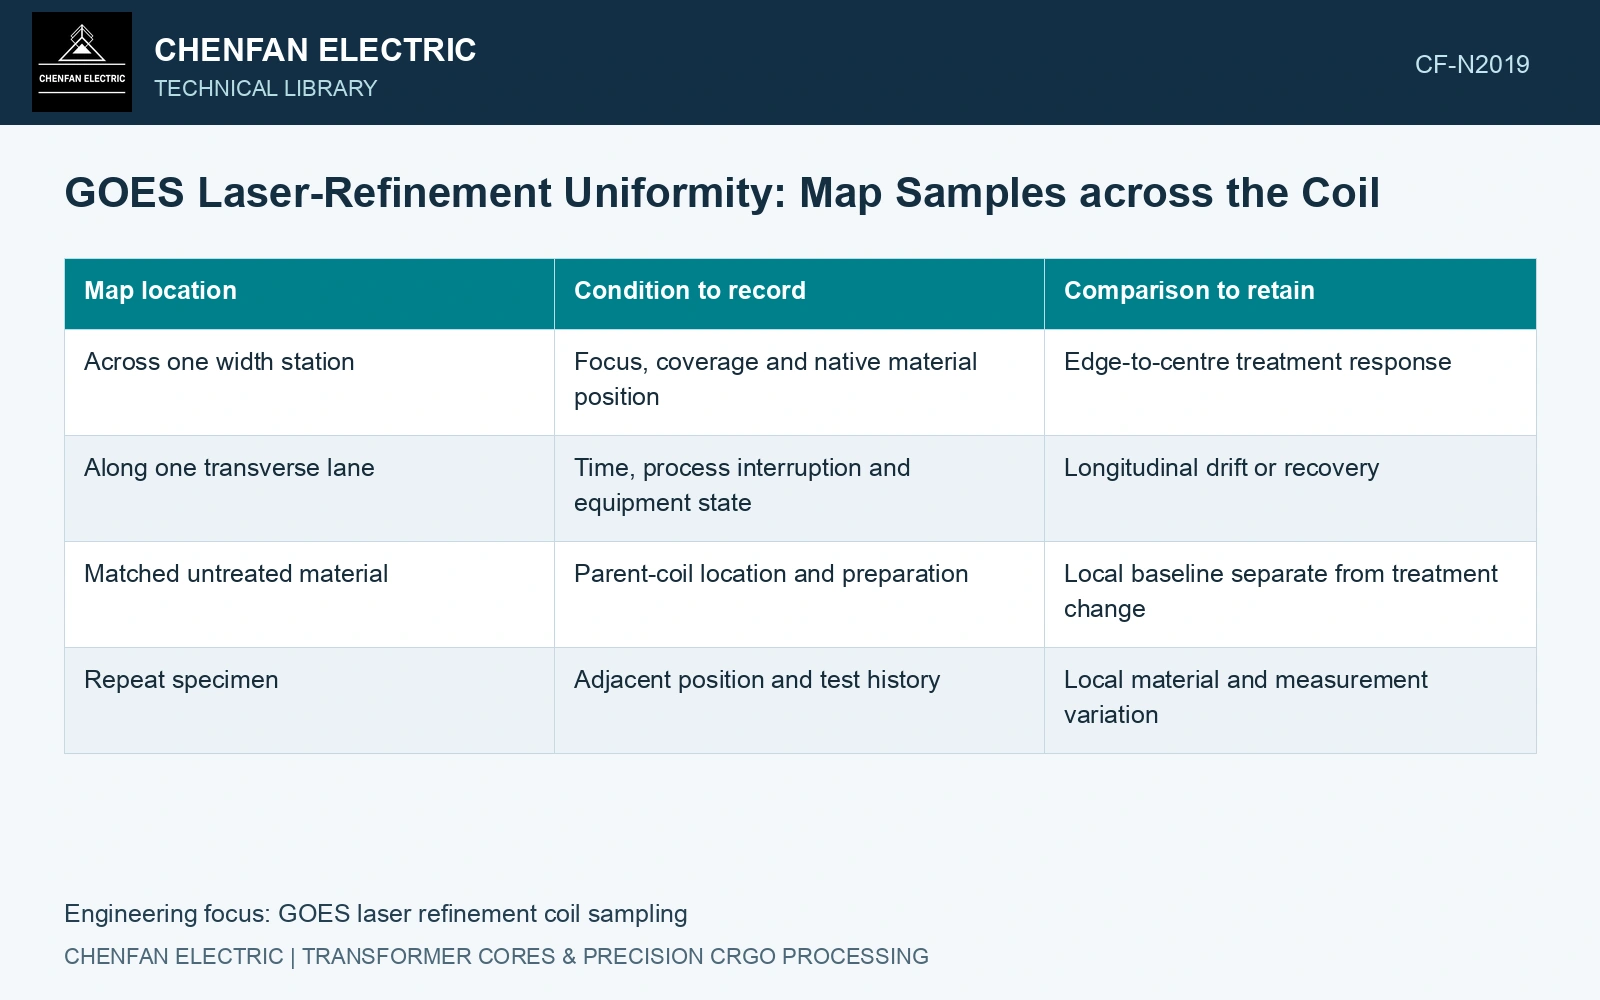
Give every specimen an address
Define longitudinal position from a retained coil datum and transverse position from a named edge. Record the specimen orientation and which face was treated. Include the sampling window dimensions: a wide specimen may average several treatment conditions, while a narrow specimen can increase edge influence.
Use longitudinal stations representing the relevant process history, such as the beginning, stable operation, a documented interruption and the end. Across each selected station, retain edge, intermediate and centre positions where they are relevant to the treatment width. This is a map design, not a universal sample count.
| Map location | Condition to record | Comparison to retain |
|---|---|---|
| Across one width station | Focus, coverage and native material position | Edge-to-centre treatment response |
| Along one transverse lane | Time, process interruption and equipment state | Longitudinal drift or recovery |
| Matched untreated material | Parent-coil location and preparation | Local baseline separate from treatment change |
| Repeat specimen | Adjacent position and test history | Local material and measurement variation |
Separate absolute quality from treatment benefit
At a registered position, compare refined specific loss with a suitable matched untreated baseline at the same test condition. The local difference describes the treatment effect only to the extent that the control is representative. A longitudinal reserve strip at one edge may not represent untreated material at the centre.
Report both the final property and the estimated benefit. A position can have a good refinement difference yet still miss the required final loss because the parent material started higher. Another can meet the final limit while showing little measurable treatment benefit.
Preserve the map through the laboratory
Keep position identification through cutting, preparation and testing. Maintain the product’s relevant thermal state; an unqualified preparation step can change a laser-refined condition. Record missing or invalid specimens rather than replacing them silently with convenient samples from another location.
Choose sampling density and acceptance rules from the observed variability, measurement uncertainty and risk of a localized defect. A process change may justify denser mapping near its transition. The primary laser study demonstrates sensitivity to treatment conditions on laboratory specimens, not the uniformity of a full production coil. [1]
At 1.7 T, 50 Hz, 23ZH90 catalogue maximum is 0.90 W/kg [2]. Assume mapped specimens give 0.87, 0.91 and 0.86 W/kg on the catalogue test basis, mean 0.88. Also assume each expanded uncertainty is ±0.005 W/kg [3]. The high specimen’s interval 0.905–0.915 remains above 0.90 although the mean passes. Hold and investigate that mapped region under the actual agreed sampling plan. Neither a passing average nor three addressed samples releases unsampled material automatically.
Beam focus, strip flatness, track spacing and cutting/annealing history must remain traceable to each specimen address. Use both untreated and treated witnesses to distinguish native coil variation from treatment non-uniformity.
Show measured and unsampled regions on the coil map. Buyers can then locate a weak lane or interval and judge how well the sampling represents the order.
References
- P. Rauscher et al., The influence of laser scribing on magnetic domain formation in grain oriented electrical steel visualized by directional neutron dark-field imaging, Scientific Reports 6, 38307, 2016, Table 1. DOI: 10.1038/srep38307.
- Nippon Steel Corporation, Grain-Oriented Electrical Steel Sheets, catalogue D004je, April 2020, specification and typical-property tables.
- B. N. Taylor and C. E. Kuyatt, NIST Technical Note 1297, Guidelines for Evaluating and Expressing the Uncertainty of NIST Measurement Results, 1994, sections 5 and 6.