

Specific loss and peak magnetizing current describe different parts of GOES excitation. Measure both after laser refinement to identify a material that meets the transformer’s energy and waveform requirements.
Match the flux waveform first
Compare treated and untreated specimens at the same induction, frequency and magnetic preparation. Retain the actual flux-density waveform, not just its peak value. If one test has a flatter or more distorted waveform, differences in current and loss cannot be assigned solely to the material treatment.
For a core test, induced voltage provides information about flux change, with the winding and measurement arrangement. Record how flux was derived, including integration and offset handling. A commanded supply voltage is insufficient evidence that both specimens experienced identical flux waveforms.
Keep three excitation measures
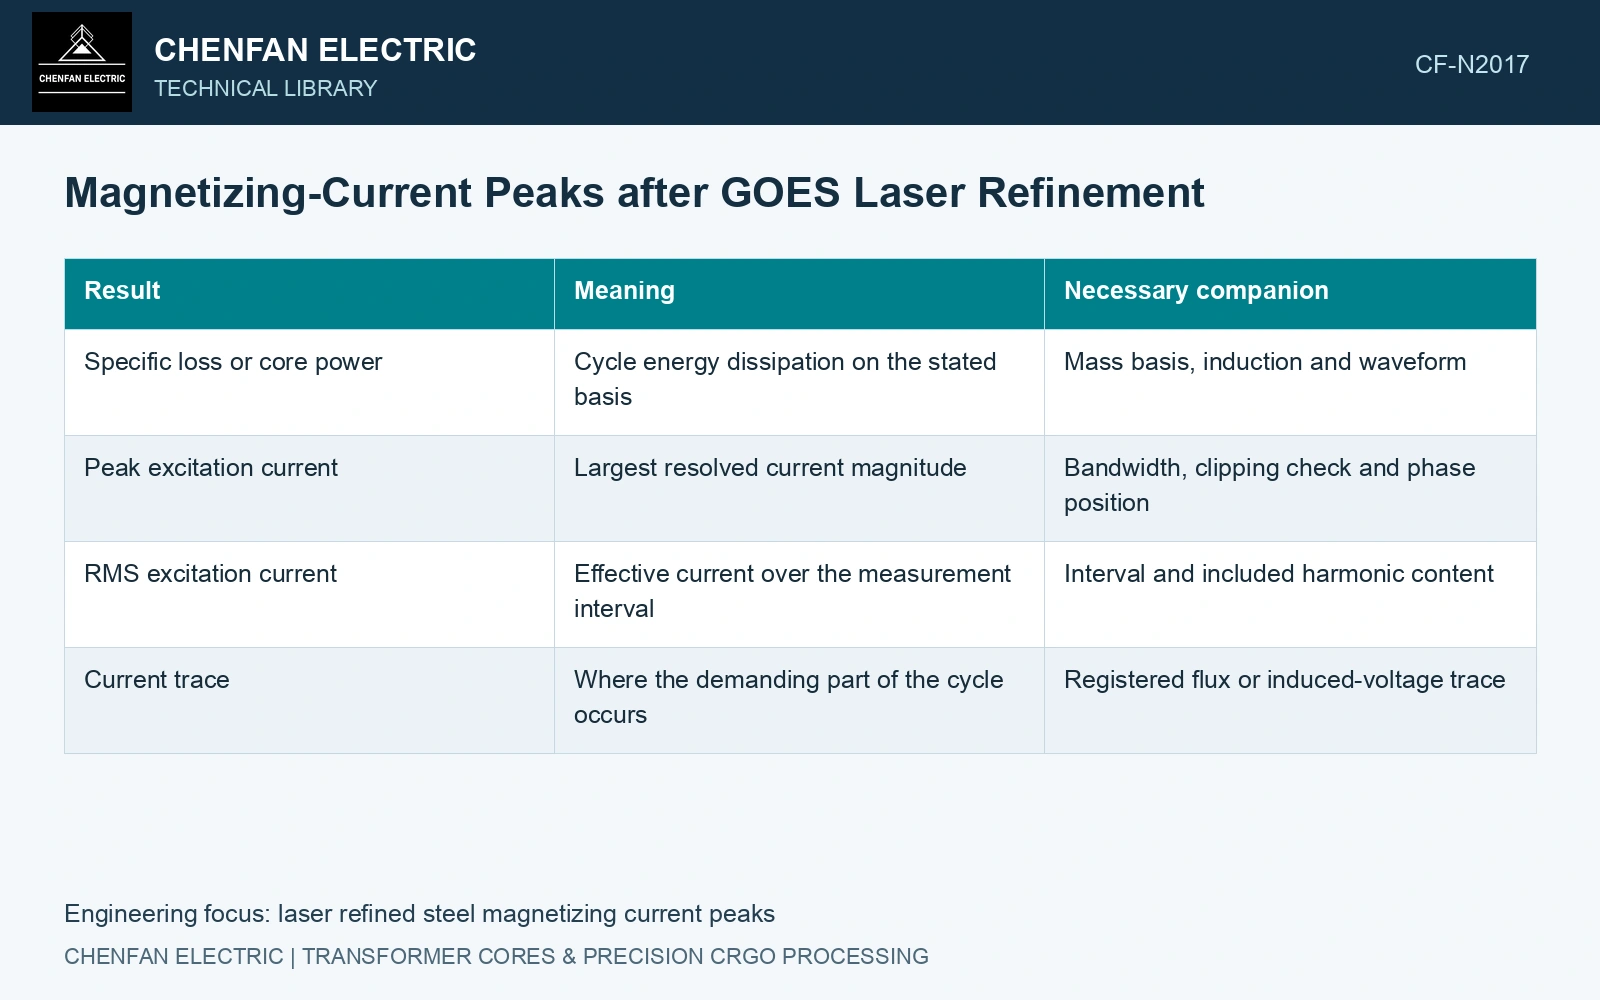
Record peak current magnitude, RMS current and the phase-resolved trace. Define crest factor as peak magnitude divided by RMS current. It describes waveform shape; it is not a substitute for either absolute current value. For an illustrative waveform with a 2.4 A peak and 0.80 A RMS, the crest factor is 3.0. Those fictional values do not represent a refined grade.
| Result | Meaning | Necessary companion |
|---|---|---|
| Specific loss or core power | Cycle energy dissipation on the stated basis | Mass basis, induction and waveform |
| Peak excitation current | Largest resolved current magnitude | Bandwidth, clipping check and phase position |
| RMS excitation current | Effective current over the measurement interval | Interval and included harmonic content |
| Current trace | Where the demanding part of the cycle occurs | Registered flux or induced-voltage trace |
Investigate a sharper peak without guessing its cause
A higher peak can be associated with a changed magnetization curve, local magnetic nonuniformity or a different test condition. Calling it local saturation requires additional evidence. A global current trace alone does not locate the responsible region or distinguish a joint effect from a sheet effect.
Check instrument range and bandwidth before interpreting the peak. A clipped sensor understates it; a low-bandwidth channel can smooth it. Compare repeated traces and ensure that any current-channel phase delay is addressed before linking a peak to a point on the flux cycle.
The primary laser experiment evaluates the magnetic response of its specimens under stated conditions. Its sheet-loss comparison does not establish the completed core’s excitation-current waveform. Measure that waveform on the identified assembly at the specified induced voltage and frequency before assigning a crest-factor benefit. [1]
The catalogue loss comparison condition is 1.7 T at 50 Hz. [2] Assume a current-waveform trial reproduces that peak induction with an RMS current of 0.80 A in both specimens; their assumed peak magnitudes are 2.0 A and 2.4 A. Crest factors are 2.50 and 3.00, a 20% increase despite unchanged RMS current. If instantaneous copper resistance is assumed constant at 2 Ω, both RMS copper-loss screens remain 1.28 W. The higher peak therefore does not alone establish greater copper loss or poorer steel loss. Verify the integrated flux waveform, phase-resolved current and directly measured magnetic loss before interpreting the changed shape.
Laser treatment, cut-edge stress, joint gap and clamp state can change the excitation waveform. Keep those states fixed during the paired test and do not allow a changed flux waveform to masquerade as a treatment effect.
Compare loss savings and excitation peaks together against the specified transformer limits. This two-axis decision makes the energy benefit and the governing current duty explicit.
References
- P. Rauscher et al., The influence of laser scribing on magnetic domain formation in grain oriented electrical steel visualized by directional neutron dark-field imaging, Scientific Reports 6, 38307, 2016, Table 1. DOI: 10.1038/srep38307.
- Nippon Steel Corporation, Grain-Oriented Electrical Steel Sheets, catalogue D004je, April 2020, specification and typical-property tables.