

An electrolyzer can spend time producing at minimum load, energized without useful DC output, or fully deenergized. Those states have different transformer loss premises. Grouping them all under “low load” can distort an energy assessment. IEC 61378-1 covers industrial converter-transformer specification, design and testing [1].
Define the actual states and their durations. Record source voltage, frequency, tap, cooling and converter control for each. A nominal DC percentage is insufficient to describe the AC branch currents.
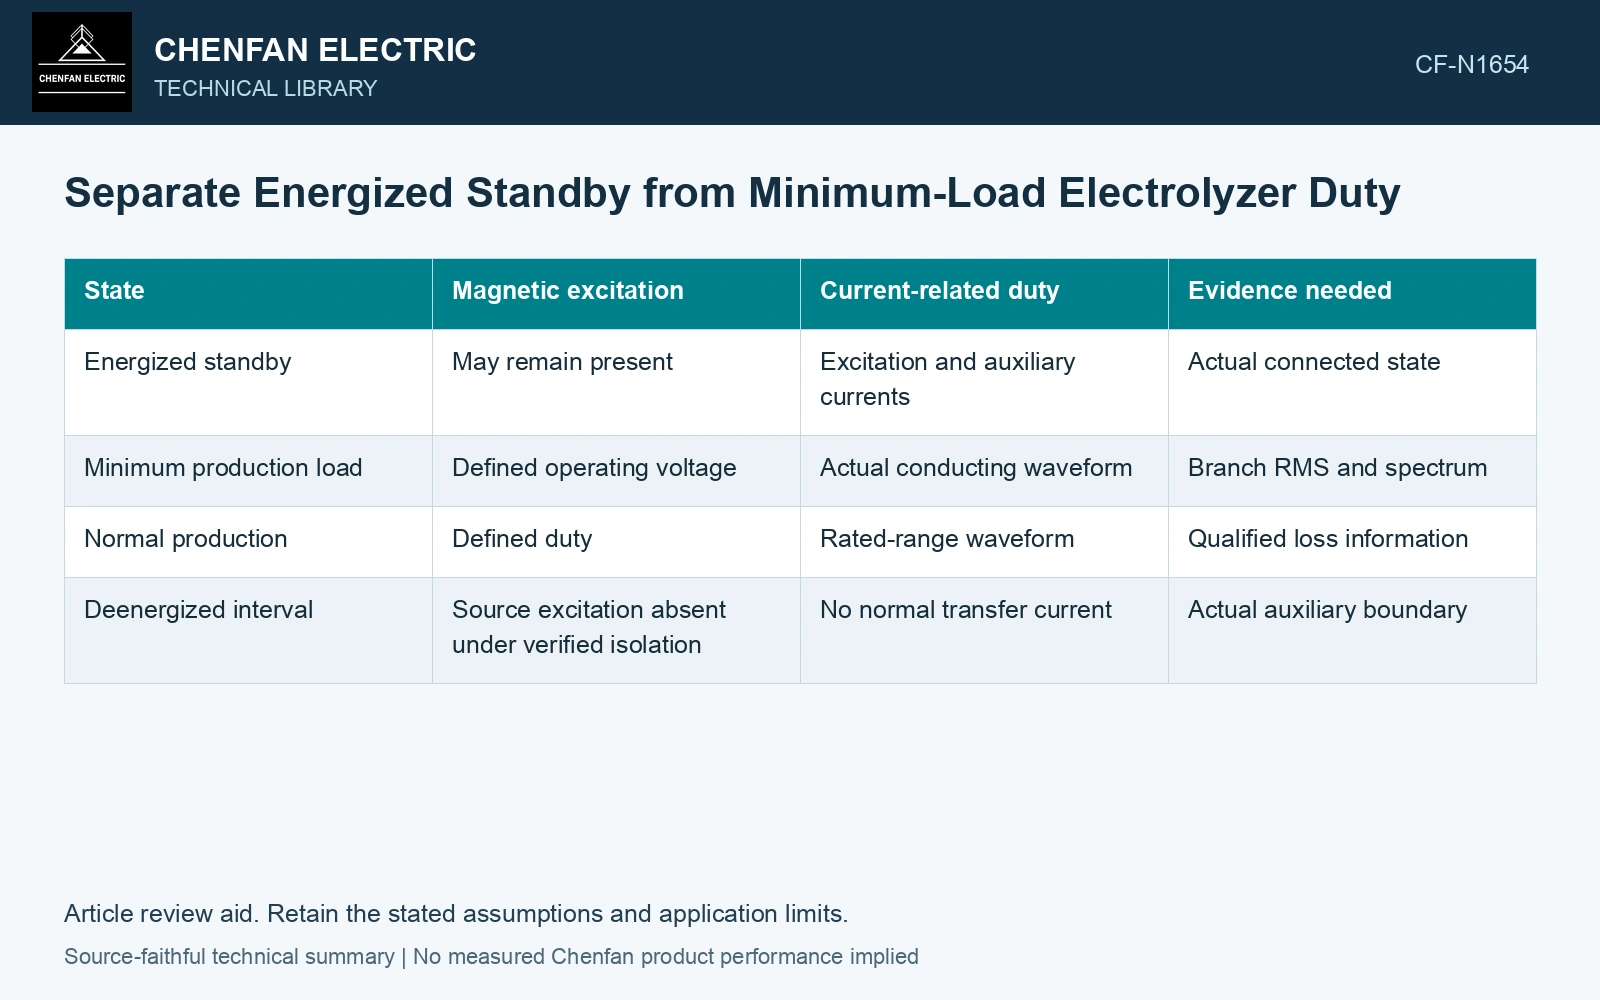
Build a state-based loss ledger
| State | Magnetic excitation | Current-related duty | Evidence needed |
|---|---|---|---|
| Energized standby | May remain present | Excitation and auxiliary currents | Actual connected state |
| Minimum production load | Defined operating voltage | Actual conducting waveform | Branch RMS and spectrum |
| Normal production | Defined duty | Rated-range waveform | Qualified loss information |
| Deenergized interval | Source excitation absent under verified isolation | No normal transfer current | Actual auxiliary boundary |
Core-related excitation loss is approximately independent of load only when the magnetic excitation and relevant state remain sufficiently similar. A changed tap, source distortion or temperature can alter it. Keep that condition with any “fixed loss” term.
For a simple conductor contribution, use I²R at the actual temperature and winding RMS. Additional frequency-dependent losses require more than total current. At minimum load, discontinuous conduction can change peak and harmonic content relative to a scaled rated waveform.
Weight energy by actual time
For piecewise steady states, annual or period energy is E = ΣPi ti, with Pi in kilowatts and ti in hours giving kilowatt-hours. Transition energy and changing-temperature intervals need additional treatment where material.
Use the same loss boundary for every state. Including fans and control auxiliaries in one figure but excluding them from another creates an inconsistent comparison. State whether the analysis covers the transformer alone or the wider conversion system.
Compare standby and production energy on one boundary
Assume an 8760 h schedule at 50 Hz: 4000 h energized standby at 20 kW transformer loss, 3000 h production at 100 kW total transformer loss, and 1760 h fully de-energized with zero loss inside this boundary. Energy is 4000 × 20 + 3000 × 100 = 380,000 kWh; standby contributes 80,000 kWh, or 21.05%. Compare offers using this complete schedule and the same auxiliary boundary. A production-only efficiency comparison omits more than one-fifth of the assumed loss energy.
Check the minimum-load waveform
Measure or validate the AC currents at the actual low-load control point. Compare conduction intervals, RMS, peaks and spectra. A small average DC output does not guarantee that each loss contribution falls by the same fraction.
Consider source-voltage variation and the tap strategy used to maintain the required DC window. The minimum-load point may not correspond to the nominal tap or magnetic state.
For procurement comparison, request loss evidence at states that represent the intended schedule, with clear assumptions. Avoid substituting a generic load profile or one favorable efficiency point for the plant’s actual operation.
Compare the energy contribution of each operating state, then address the dominant loss within that state. Low utilization can increase the relative importance of standby energy without making winding loss negligible during minimum production.
Retain an explicit measurement model and input uncertainties when comparing measured and calculated duty [2].
References
- IEC, IEC 61378-1:2011, Converter transformers – Part 1: Transformers for industrial applications.
- JCGM, JCGM 100:2008, Evaluation of measurement data — Guide to the expression of uncertainty in measurement, 2008.