

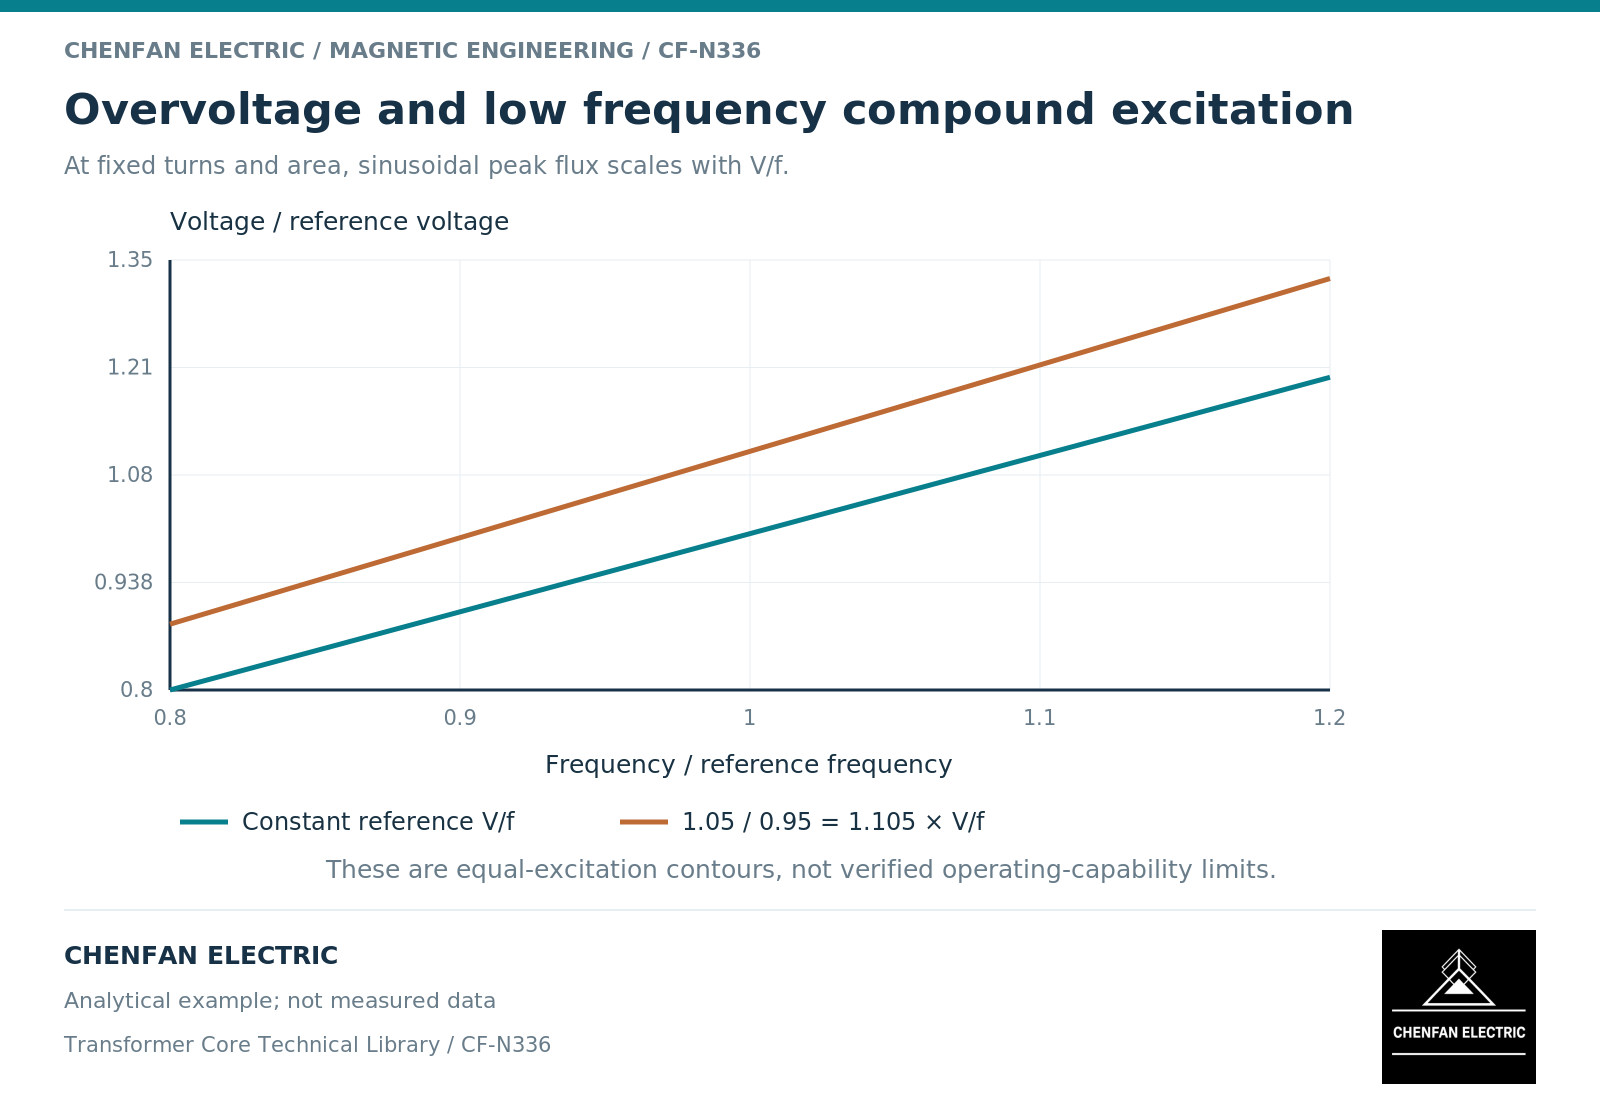
Overvoltage and underfrequency must be combined when assessing core excitation. For a sinusoidal induced winding voltage with unchanged turns and net area, peak flux density scales with voltage divided by frequency. Checking the voltage and frequency deviations independently can understate their combined effect.
Use winding voltage, not an undefined system percentage
The familiar relationship E_rms = 4.44 f N A_net B_peak applies to sinusoidal induced voltage and a consistently defined magnetic area. [1] E_rms is the root-mean-square voltage of the winding under consideration, not automatically the system line voltage.
Tap position changes the effective turn count. A voltage percentage quoted on one tap cannot be transferred to another without checking the turns basis. Connection also matters when converting line voltage into winding voltage.
When terminal drops or distortion are significant, use the induced-voltage waveform and its integral rather than relying only on a scalar volts-per-hertz ratio.
Calculate the combined ratio explicitly
Consider an illustrative case at 1.05 per-unit induced voltage and 0.95 per-unit frequency, with turns and area unchanged. The flux-density ratio is 1.05/0.95 = 1.1053, approximately 10.5 percent above the reference value.
It is not merely a five-percent excitation increase. Nor should the two percentages be added as a universal rule; division gives the correct ratio under the stated assumptions. If the turn count changes, its ratio belongs in the same calculation.
These numbers are an arithmetic example, not an allowable overexcitation limit. The acceptable duration and consequence depend on the complete transformer design and the applicable project requirements.
Build an envelope with time and operating state
A continuous operating condition, a short disturbance and repeated excursions can have different thermal consequences. The magnetic calculation identifies the excitation; the loss and thermal assessments determine what that excitation means over time.
The nonlinear magnetizing response also means that current and loss need not increase in the same proportion as flux density. Saturation models require a supported characteristic and a consistent circuit representation. [2]
| Envelope coordinate | Why it belongs in the review |
|---|---|
| Induced winding voltage | Sets the voltage-time excitation |
| Frequency | Sets the duration of each alternating excursion |
| Tap and turns | Converts winding voltage to volts per turn |
| Waveform | Determines whether a sinusoidal ratio is adequate |
| Duration and repetition | Connects excitation to heating |
| Initial loading and cooling | Establishes the thermal starting boundary |
A two-dimensional voltage-frequency plot is useful, but it should reference the separate duration and thermal conditions rather than implying one unlimited safe region.
Handover the controlling cases
Identify the combinations that maximize the relevant flux excursion, not only the largest voltage and lowest frequency listed in separate documents. Confirm whether those extremes can occur together in the specified system; otherwise label the combination as a conservative study case.
Provide the resulting branch-flux requirements to the core design review, together with the winding and tap basis. The complete-transformer assessment must retain winding loss, structural heating and cooling responsibilities.
The useful conclusion is a defined excitation envelope with a stated evidence basis. It should not be replaced by a generic claim that a material grade “handles overvoltage,” nor by a voltage-only check that ignores an accompanying frequency reduction.
References
[1] Lloyd Dixon / Texas Instruments. Magnetics Design 1 – Introduction and Basic Magnetics.
[2] Manitoba Hydro International / PSCAD. The Classical Approach.