

A dielectric spectrum depends on oil conductivity, paper moisture, temperature and geometry. Different parameter combinations can sometimes produce similar curves within the measured range. A visually good fit therefore does not automatically identify one moisture value. [1]
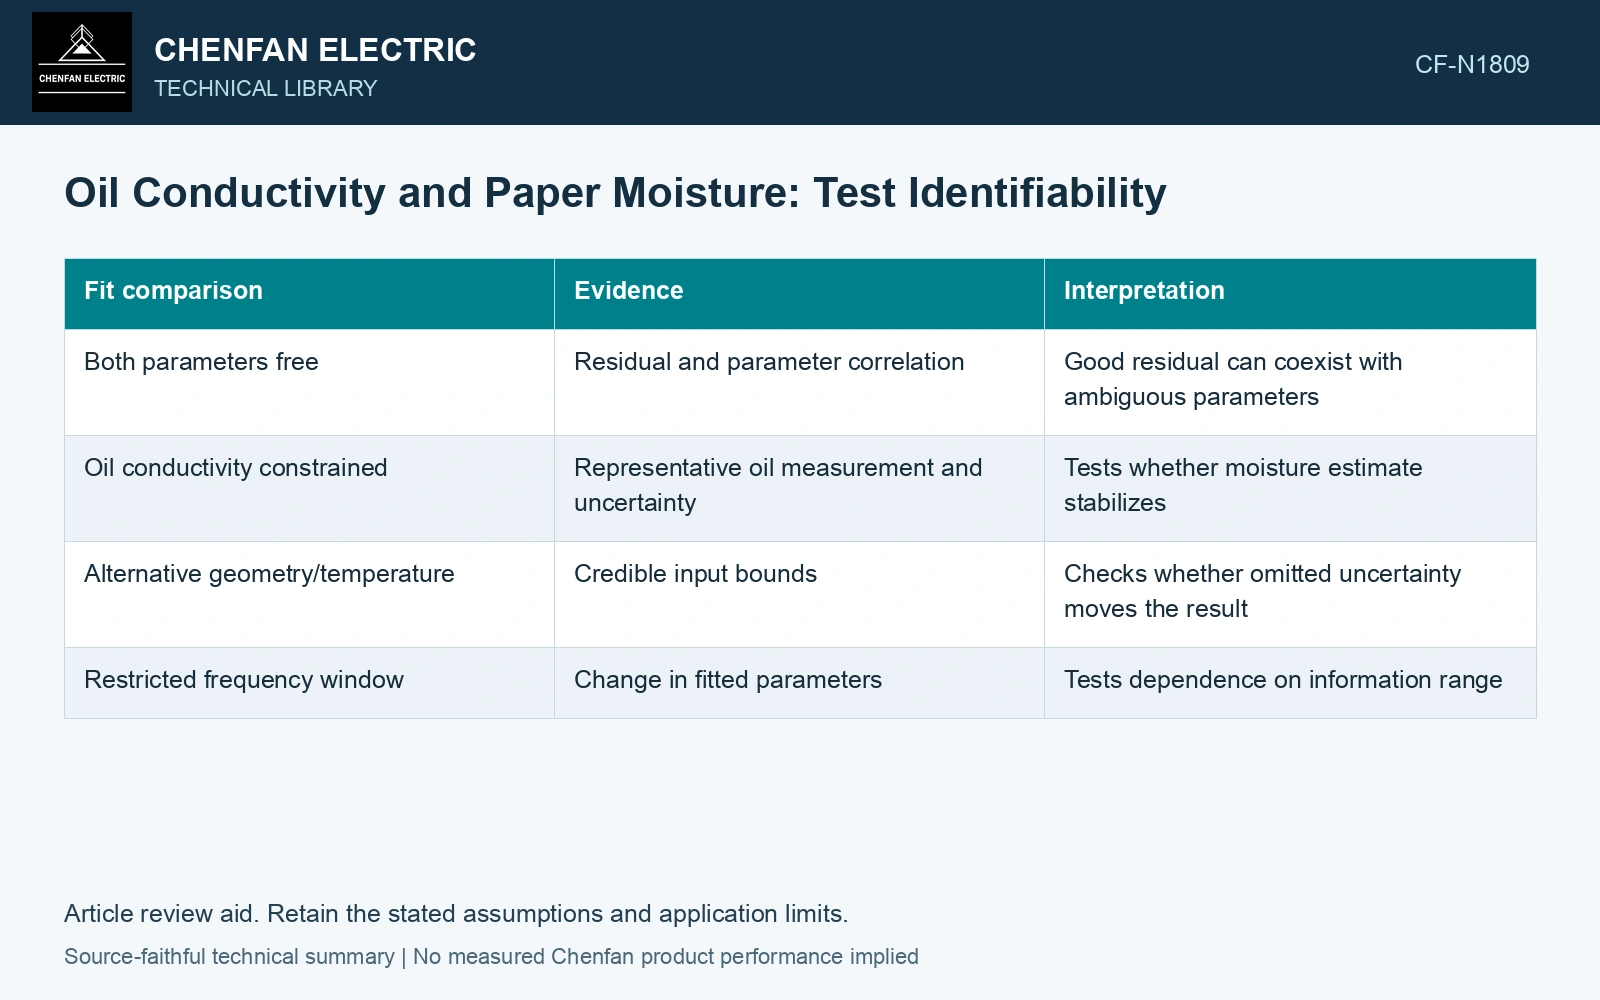
Compare parameter effects in the measured range
Let y(f;σ,m) denote a measured response model, with oil conductivity σ and model moisture parameter m. Examine changes in y when each parameter varies within credible bounds. If their sensitivity shapes are similar over the available frequencies, the data may have difficulty separating them.
| Fit comparison | Evidence | Interpretation |
|---|---|---|
| Both parameters free | Residual and parameter correlation | Good residual can coexist with ambiguous parameters |
| Oil conductivity constrained | Representative oil measurement and uncertainty | Tests whether moisture estimate stabilizes |
| Alternative geometry/temperature | Credible input bounds | Checks whether omitted uncertainty moves the result |
| Restricted frequency window | Change in fitted parameters | Tests dependence on information range |
Use an oil sample as a constraint, with limits
Retain liquid type, sample handling, temperature and the method’s reference conversion. The sampled liquid may not represent every internal region or the exact state during the dielectric test. Its uncertainty should constrain the model rather than become an unquestioned constant.
Additional frequencies can improve information only if their signal and model sensitivity are useful. Adding noisy points does not inherently resolve parameter ambiguity.
Arsad and co-authors describe fitting an oil-paper model using both water content and oil conductivity. Preserve the reference material and geometry along with both fitted parameters; one low residual does not independently validate them. [2]
Compare materially different acceptable fits
Assumptions at 20 °C: a deliberately rank-deficient model yields normalized observable g(f) = a(f)[σ + km], with known a(f), k = 10 pS/m per moisture percentage point, and measured g/a = 35 pS/m. Here m is the numerical dry-basis water percentage; this is an assumed sensitivity model, not an oil-paper calibration. Solutions σ = 10 pS/m, m = 2.5% and σ = 20 pS/m, m = 1.5% both give 35 pS/m at every modeled frequency. More points with the same sensitivity shape cannot separate them. An independent representative conductivity interval 10–14 pS/m instead constrains m = (35 − σ)/10 to 2.1–2.5%. Report this bounded model-dependent interval and qualify its material/temperature basis before issuing a moisture disposition. [1][2]
References
- IEEE, IEEE C57.161-2018, IEEE Guide for Dielectric Frequency Response Test.
- S. R. Arsad et al., Water Content in Transformer Insulation System: A Review on the Detection and Quantification Methods, Energies 16, 1920, 2023. DOI: 10.3390/en16041920.