

A longer PDC charging stage takes more test time but can expose slower dielectric processes. A short stage can leave the depolarization trace dependent on finite charging. The right duration must follow the required analysis and equipment procedure, not a universal timer. [1]
Use the same geometry, temperature and initial electrical condition when comparing durations. Prior voltage can leave memory that changes the trace independently of the new charging time.
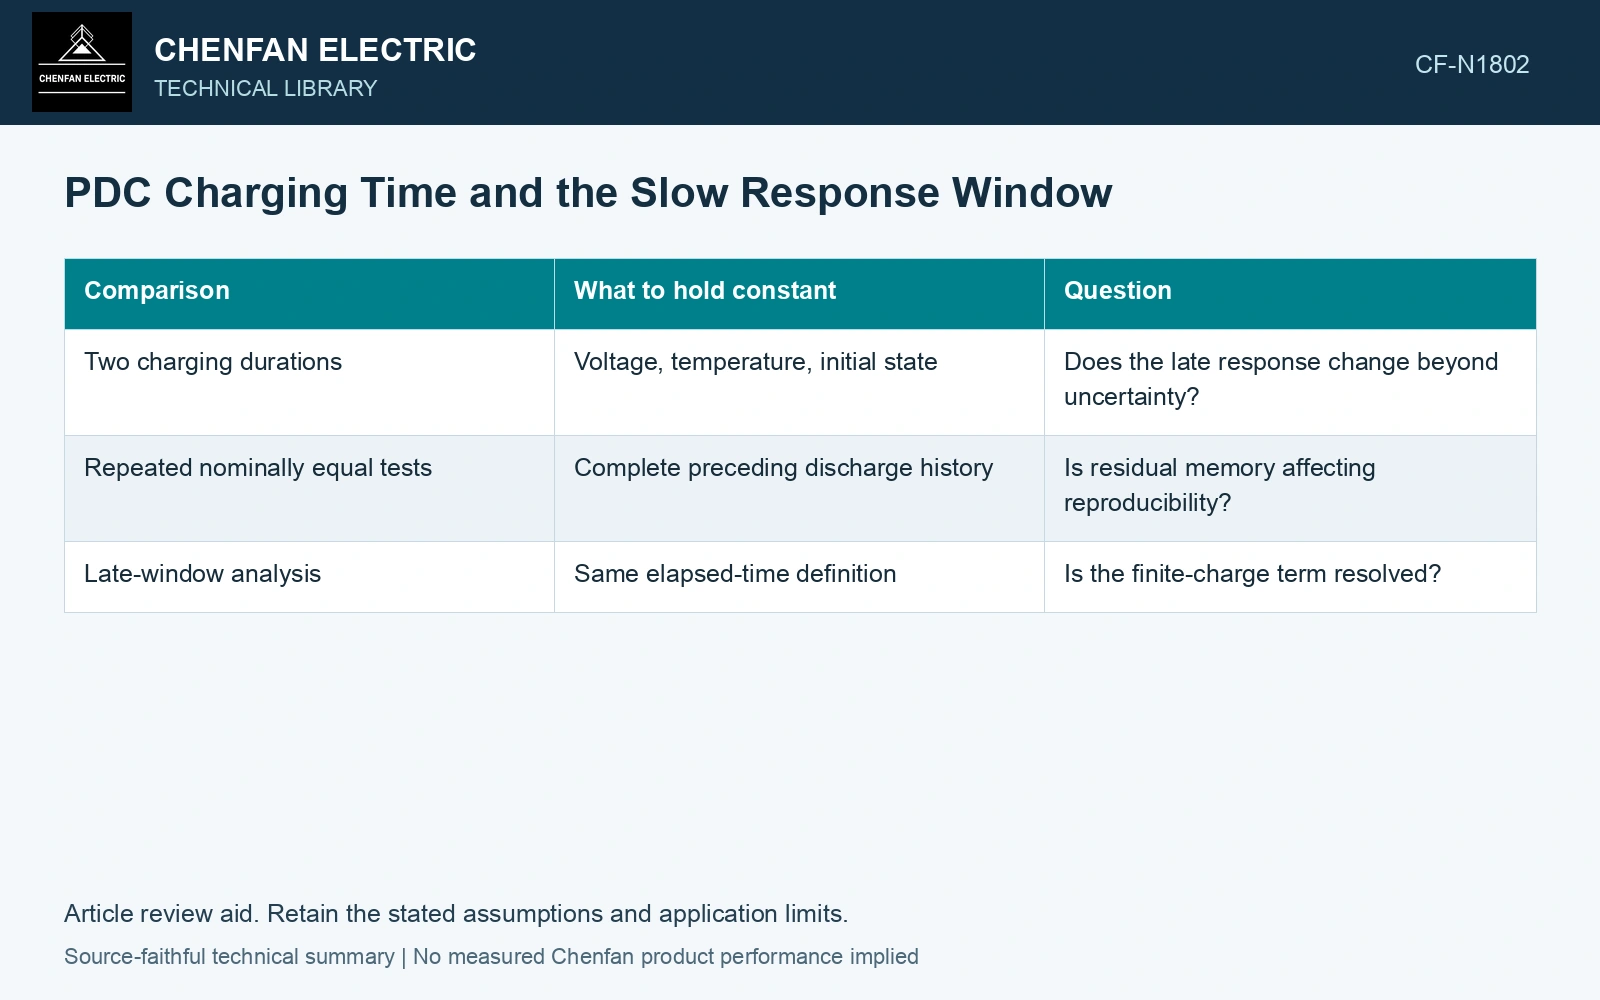
Compare durations through the response model
For an illustrative relaxed linear system with step-response tail g(t), depolarization after a charge lasting tc has magnitude g(t) − g(t+tc). If g(t+tc) is still significant, the measured decay is not the infinite-charge response. Currents are amperes and times seconds.
| Comparison | What to hold constant | Question |
|---|---|---|
| Two charging durations | Voltage, temperature, initial state | Does the late response change beyond uncertainty? |
| Repeated nominally equal tests | Complete preceding discharge history | Is residual memory affecting reproducibility? |
| Late-window analysis | Same elapsed-time definition | Is the finite-charge term resolved? |
Keep total test time honest
Charging, depolarization, instrument stabilization and required discharge all contribute to the test schedule. Extending charging without preserving temperature stability can trade one uncertainty for another. Record temperature drift through the full measurement.
A near-flat late current is not sufficient proof of equilibrium; drift or a broad response can resemble a plateau. Compare background and the model’s sensitivity to the finite charging term.
Raxsa and co-authors retain the finite-charge multiplier 1 − exp(−tc/τ) for each RC relaxation branch. Use that factor with the actual charging history before comparing late depolarization currents. [2]
Calculate finite-charge suppression
Assume a single relaxation tail g(t)=100 exp(−t/100) pA with time in seconds, observed 50 s after voltage removal. For 100 s charging, depolarization magnitude is 38.34 pA; for 500 s charging it is 60.24 pA. Longer charging changes the observed tail without changing material parameters. Include charging duration in the model.
References
- IEEE, IEEE C57.161-2018, IEEE Guide for Dielectric Frequency Response Test.
- J. Raxsa, P. Nimsanong, T. Mai-Eiam and P. Yutthagowith, Determination of Dielectric Models Based on Effective Multi-Exponential Fittings, Energies 16, 4615, 2023. DOI: 10.3390/en16124615.