

At light load, a rectifier’s DC current may reach zero during part of the cycle. Average DC output then gives an incomplete description of its pulse peaks and the current seen by each transformer winding. IEC 61378-1 covers industrial converter-transformer specification, design and testing [1].
Determine the conducting states using the actual load and control model. Include the DC inductance, back voltage where present and the relevant source impedance. A waveform taken at rated continuous current should not simply be scaled down until it represents minimum load.
A pulse example shows the missing information
Assume a positive triangular DC pulse of peak IP occupying fraction D of each repeating period. Its average is Iavg = IPD/2 and its RMS is IP√(D/3). For a fixed average, IP = 2Iavg/D and Irms = 2Iavg/√(3D).
The relations show how a narrower pulse requires a higher peak for the same average. They describe the stated triangle, not every discontinuous rectifier. The transformer phase and segment currents must still be derived from the conduction paths.
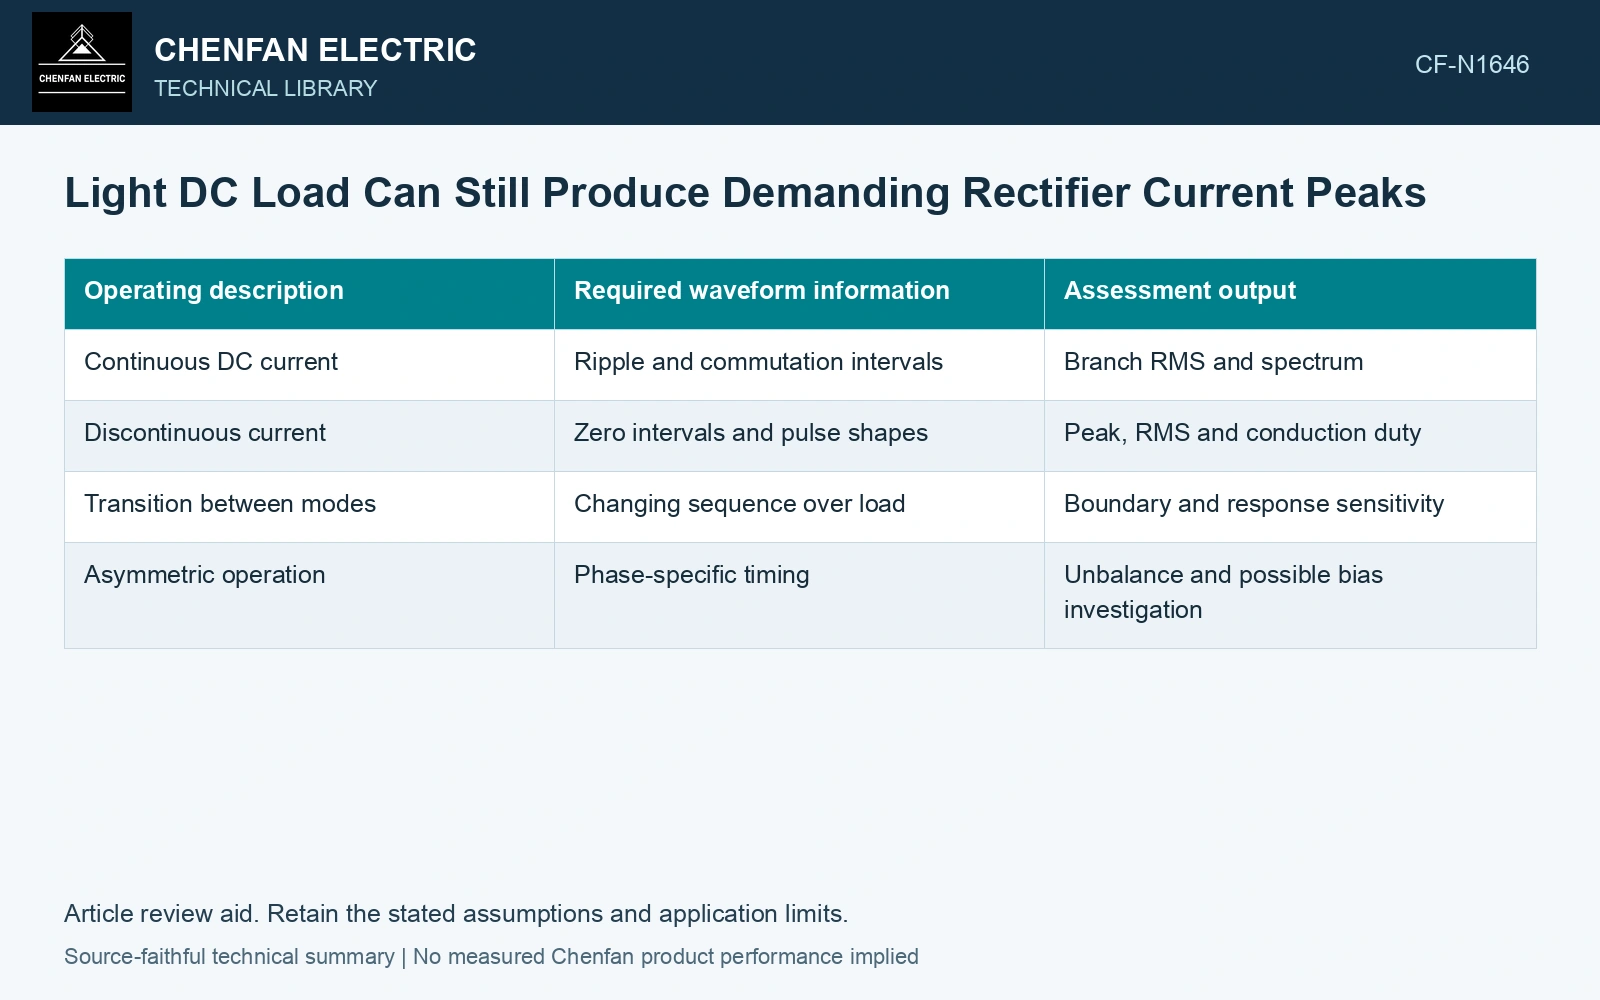
| Operating description | Required waveform information | Assessment output |
|---|---|---|
| Continuous DC current | Ripple and commutation intervals | Branch RMS and spectrum |
| Discontinuous current | Zero intervals and pulse shapes | Peak, RMS and conduction duty |
| Transition between modes | Changing sequence over load | Boundary and response sensitivity |
| Asymmetric operation | Phase-specific timing | Unbalance and possible bias investigation |
Map pulses into the windings
Identify which phase supplies each conducting interval and how delta, polygon or parallel sections carry it. The DC pulse RMS is not automatically the RMS of one winding. Retain the full signed branch waveform for each conductor.
Compute harmonic and reactive-power behavior from the actual AC currents and voltages. A power-factor assumption taken from rated continuous operation may fail at light load. Avoid drawing a universal relationship from average DC power alone.
Check peak current separately from thermal duty. A short narrow pulse can challenge a conductor or support differently from a broad pulse with the same RMS. Device and bus limits also need their own assessment.
Compare pulses with the same average output
Assume triangular DC pulses with average 100 A. At duty fraction D = 0.40, peak is 2 × 100/0.40 = 500 A and RMS is 2 × 100/√(3 × 0.40) = 182.57 A. At D = 0.20, peak becomes 1000 A and RMS 258.20 A. The mean is unchanged, but mean-square current doubles. Retain the narrower-pulse case for branch-current, peak and additional-loss checks after mapping it through the actual rectifier conduction states.
Include the transition in the design envelope
Evaluate several points near the onset of discontinuity rather than only the nominal minimum-load condition. Small changes in source voltage or load can alter the conducting sequence and current peak.
Use measured steady records where available to challenge the modeled zero intervals. Acquisition offset can make a true zero appear nonzero, while limited bandwidth can understate a narrow peak.
Rate the affected winding from its branch-current envelopes across the low-load range, including peaks and frequency-dependent losses. A reduced average DC demand does not establish a proportional reduction in each internal duty.
Retain an explicit measurement model and input uncertainties when comparing measured and calculated duty [2].
References
- IEC, IEC 61378-1:2011, Converter transformers – Part 1: Transformers for industrial applications.
- JCGM, JCGM 100:2008, Evaluation of measurement data — Guide to the expression of uncertainty in measurement, 2008.