

Short answer
Transformer capacity electrification planning should describe each load component separately instead of applying a single growth percentage. Existing load, heat pumps and EV charging grow at different rates, peak at different times and respond to different drivers. In an illustrative 500 kVA transformer with a 300 kVA existing peak, a low-adoption scenario adds about 40 kVA of diversified heat pump load and 20 kVA of EV load, reaching 360 kVA; a high-adoption scenario adds 160 and 60 kVA, reaching 520 kVA, above rating. Because the outcome is uncertain, the plan should set observable triggers: measured winter peak above a set fraction of rating for two consecutive winters, or a count of heat pump and charger connections on the transformer. Staged upgrades driven by triggers can then be compared with early replacement, which can reduce loading risk within the assessed scenarios but may leave capacity idle for years.
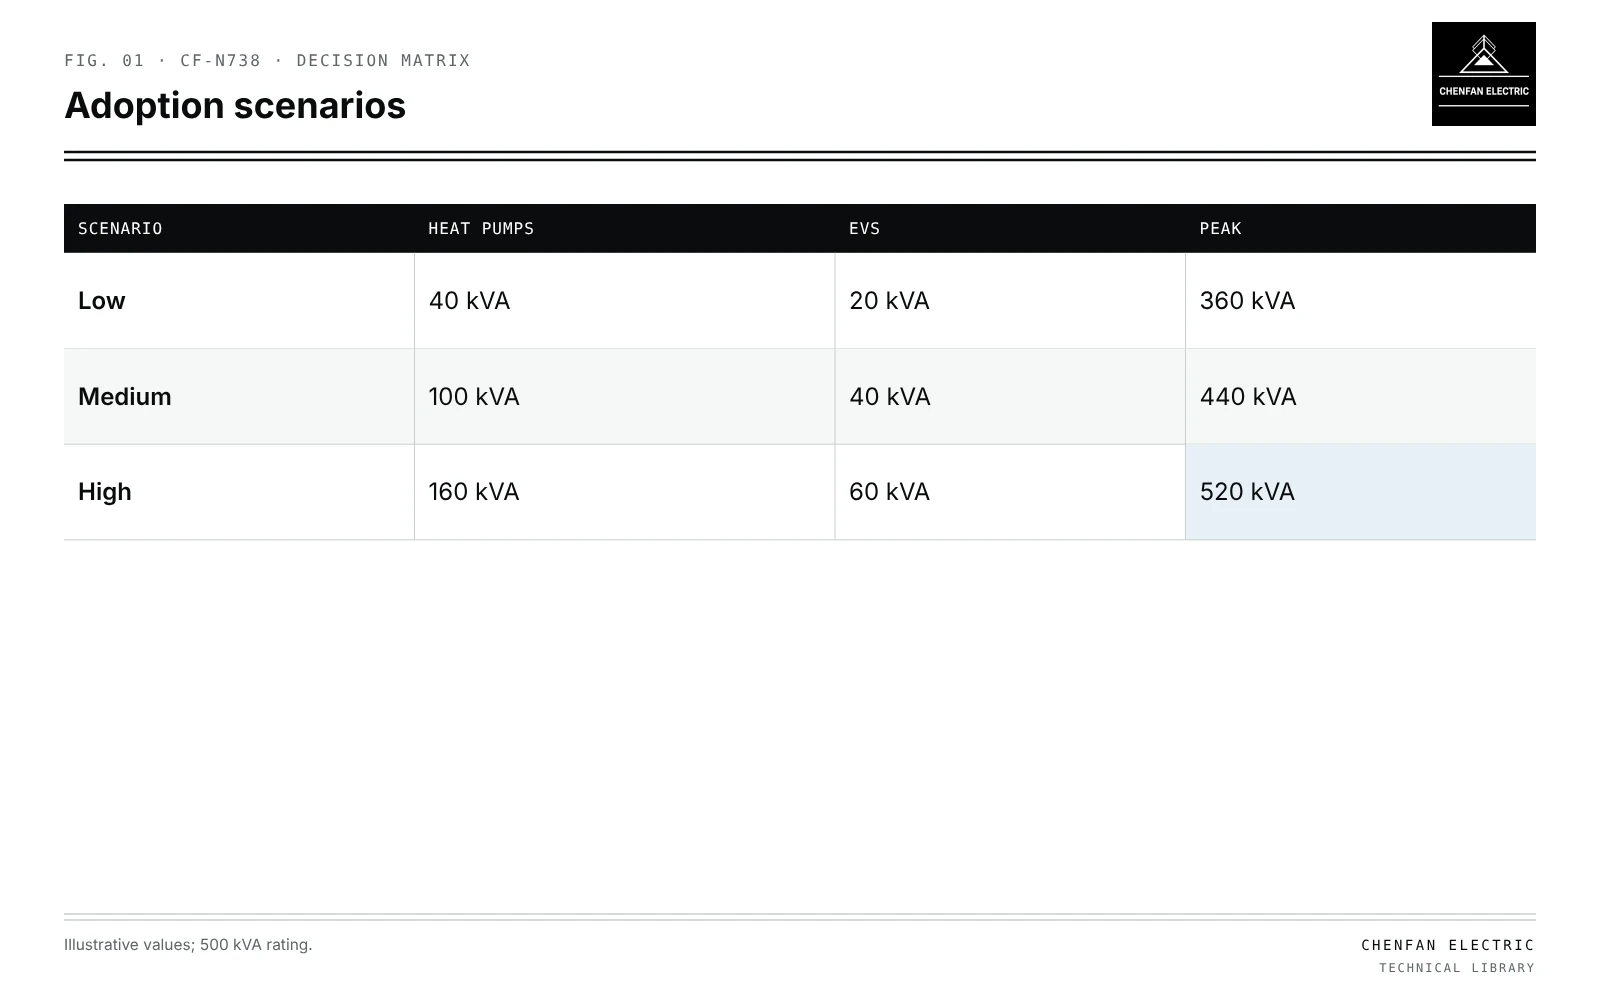
Separate components
| Scenario | Heat pumps | EVs | Peak |
|---|---|---|---|
| Low | 40 kVA | 20 kVA | 360 kVA |
| Medium | 100 kVA | 40 kVA | 440 kVA |
| High | 160 kVA | 60 kVA | 520 kVA |
| Component | Peak timing | Driver |
|---|---|---|
| Existing load | Evening | Population, appliances |
| Heat pumps | Cold mornings and evenings | Temperature, adoption |
| EV charging | Evening or tariff window | Adoption, tariffs; see correlated EV charging loads |
| PV | Midday | Offsets daytime only |
Coincidence between components matters more than their individual peaks; see Monte Carlo load scenarios without impossible combinations.
Illustrative scenarios
Illustrative example. 500 kVA transformer; existing peak 300 kVA; diversified additions: heat pump 2 kVA per home, EV 0.75 kVA per vehicle at peak. Values chosen for demonstration.
| Scenario | Heat pumps | EVs | Peak |
|---|---|---|---|
| Low | 20 homes, 40 kVA | 27 vehicles, 20 kVA | 360 kVA |
| Medium | 50 homes, 100 kVA | 53 vehicles, 40 kVA | 440 kVA |
| High | 80 homes, 160 kVA | 80 vehicles, 60 kVA | 520 kVA |
The high scenario exceeds rating; the low one leaves 28 % headroom.
Observable triggers
- Measured peak from AMI or transformer monitoring above, say, 85 % of rating for two winters; see calibrating transformer load allocation with AMI data.
- Connection counts: heat pump and charger notifications on the transformer.
- Voltage complaints or measured low voltage at end customers.
- Loss of life estimates from thermal monitoring.
Triggers should be measurable, timely and linked to a lead time long enough for replacement.
Staged versus early
| Strategy | Benefit | Risk |
|---|---|---|
| Early replacement | Capacity for the assessed scenarios, subject to actual duty | Idle capacity, higher no-load loss for years |
| Trigger-based staging | Capital spent when needed | Lead time must be met |
| Managed load | Defers upgrade | Control failure scenarios |
Compare each alternative’s guaranteed no-load loss at the applicable excitation and its expected energised hours. A larger nameplate rating alone does not establish a higher no-load loss; use the actual offered designs when evaluating early replacement.
Siting and network effects
Electrification also shortens LV service reach; see transformer siting and service reach. Hosting capacity for PV and load interact; see probabilistic hosting capacity.
What this article does not cover
It does not apply a uniform future growth margin to all transformers.
Where this reasoning stops. Per-unit diversified loads are illustrative; local data are needed.
Practical takeaway
Model existing load, heat pumps and EVs separately under adoption scenarios, define measurable triggers with adequate lead time, and compare trigger-based staging with early replacement, including no-load loss of idle capacity.