

Short answer
Normally open point parallel source errors arise when a distribution model shows a switch that should be open as closed, or omits it entirely. Two substations, or two transformers that never operate in parallel, then appear connected. Load flow results may still look plausible: currents redistribute, voltages stay within limits. But fault levels jump, losses and transformer loadings shift, and protection studies become wrong. In an illustrative case, a bus expected to see about 8 kA of fault current shows 14 kA in the model, revealing a second source through a hidden path. Checks include comparing every switch state with the operating diagram, checking that the assumed radial downstream areas have no unintended cross-substation paths, with approved DER represented separately, and comparing calculated fault levels with expected ranges. Errors found should be corrected in the source data, not just in the study copy.
How hidden parallels arise
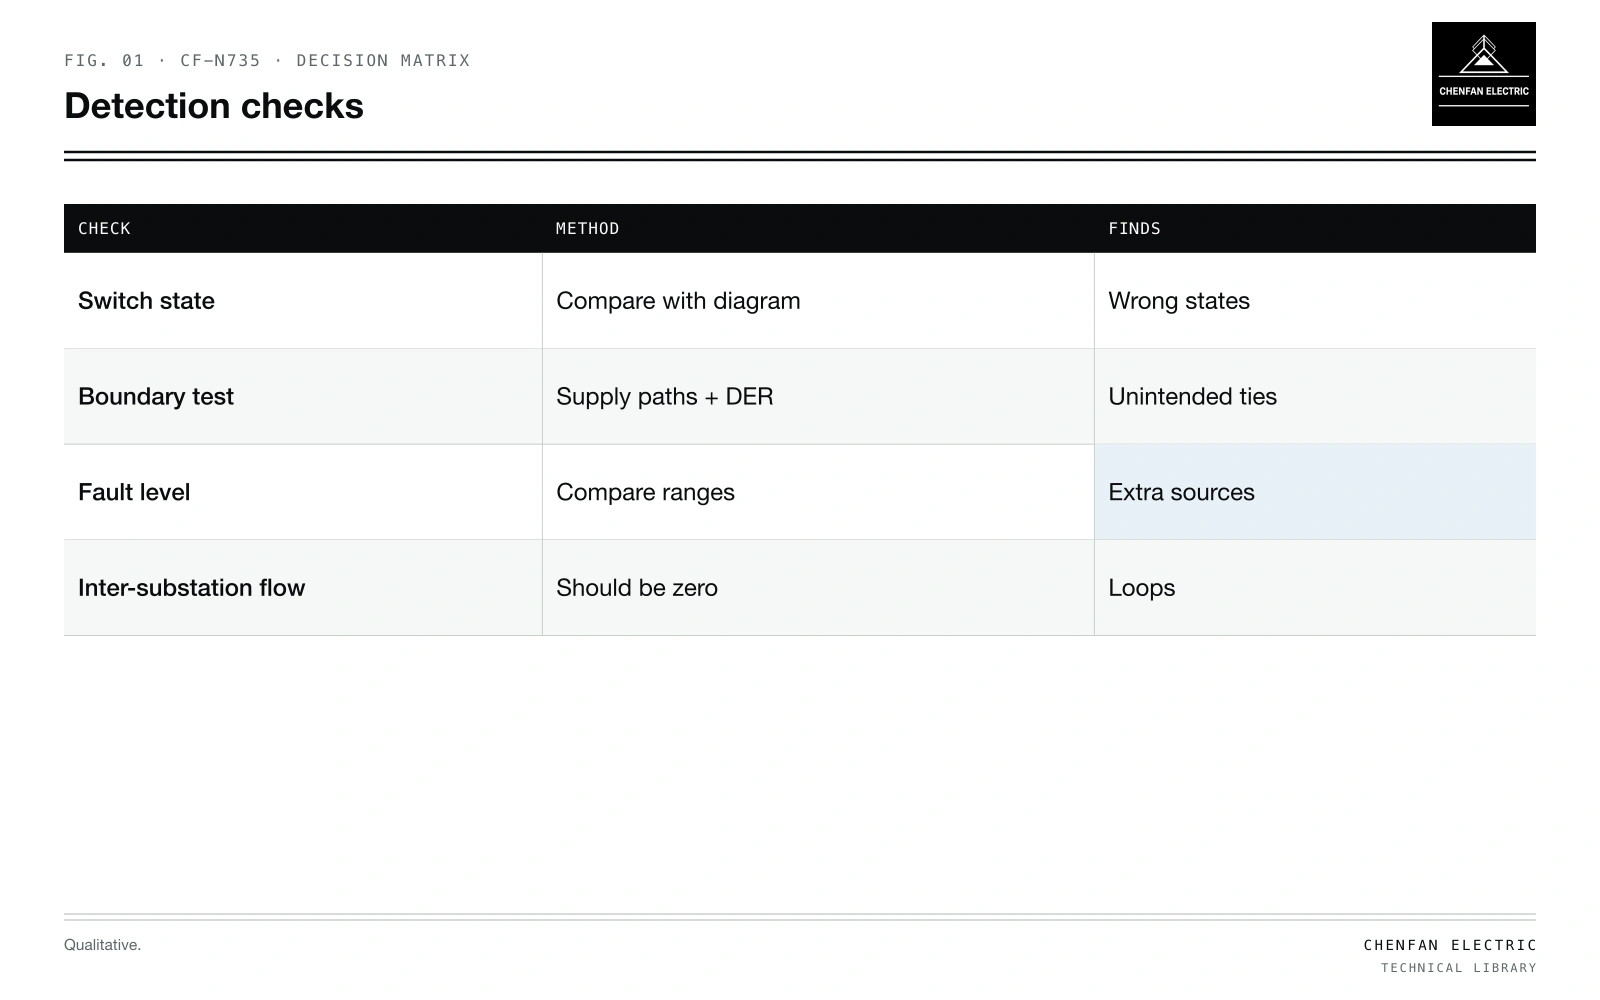
| Check | Method | Finds |
|---|---|---|
| Switch state | Compare with diagram | Wrong states |
| Boundary test | Intended supply paths and approved DER | Unintended ties |
| Fault level | Compare ranges | Extra sources |
| Inter-substation flow | Should be zero | Loops |
- Switch state imported as closed by default.
- Missing switch object; the line is continuous in the model.
- GIS topology joining lines that touch on the map; see transformer phase mapping from GIS data.
- Temporary changes left in the model after studies.
- Customer-owned ties not recorded.
Symptoms
| Symptom | Indicates |
|---|---|
| Fault level higher than expected | Extra source |
| Loading shared between substations | Parallel path |
| Losses unusually low | Parallel paths reducing current |
| Circulating power between sources | Voltage or angle difference across a loop |
| Protection miscoordination in study | Fault current from two sides |
Fault level as a test
Illustrative example. LV bus supplied from substation A; expected fault level from A alone about 8 kA. Model shows 14 kA. Values chosen for demonstration.
A 75 % rise warrants checking source paths and impedance inputs. In this example, it exposes a second source. Tracing the fault current paths in the model finds a normally open point modelled as closed, connecting to substation B. Fault levels are a sensitive test because each source contributes regardless of load.
Checks to run
- Switch states against current operating diagrams.
- Boundary test: within the assumed radial downstream areas, retain the intended substation supply paths and any approved DER; check that no unintended tie joins areas.
- Loop detection: find any closed loops in a supposedly radial network.
- Fault level ranges per bus compared with previous studies or measurements.
- Power flow between substations: should be zero in radial operation.
Effects on studies
- Reconfiguration studies start from a wrong base; see feeder reconfiguration for loss reduction.
- Tie-switch evaluation miscounts restorable load; see tie-switch placement for feeder restoration.
- Model reduction may preserve the error; see model reduction for large distribution networks.
- Feeder-head reconciliation shows unexplained residuals; see reconciling feeder-head data with transformer estimates.
What this article does not cover
Compatibility checklists for deliberate temporary paralleling of transformers are not covered here.
Where this reasoning stops. Fault level increase depends on source impedances; the example is illustrative.
Practical takeaway
Verify switch states against operating diagrams, check the intended radial boundaries and approved source paths, compare fault levels with expected values to expose hidden sources, and correct the source data.