

Short answer
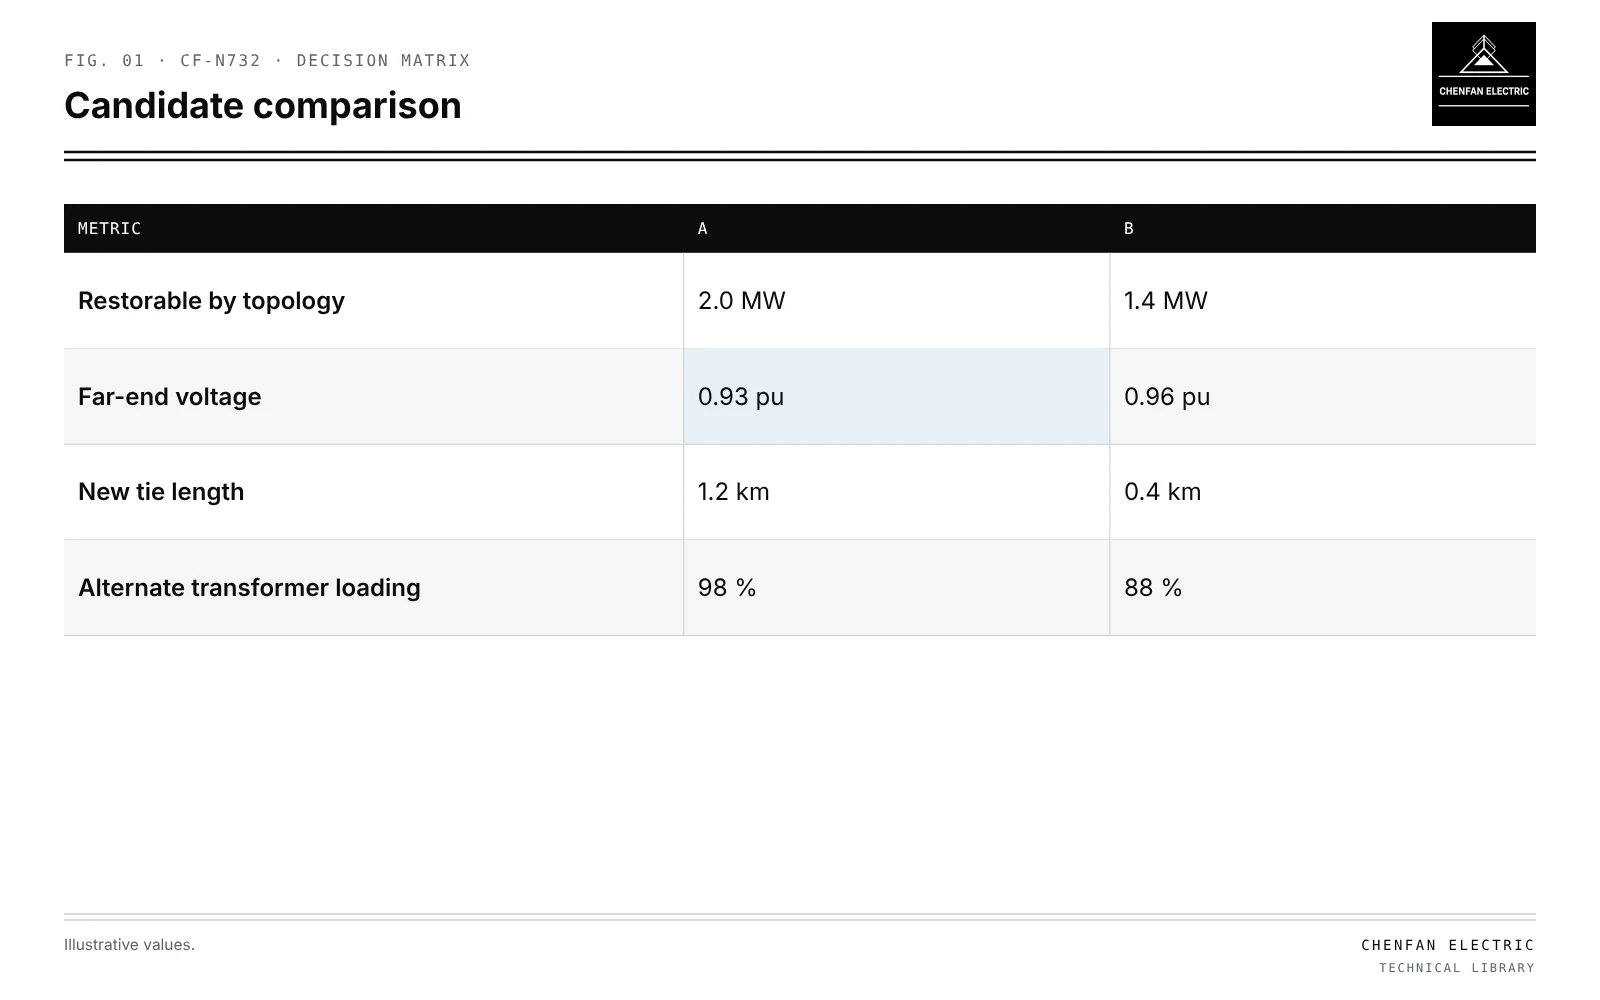
Tie switch placement feeder restoration planning decides where a normally open switch between two feeders gives the most value. After a fault, the tie lets the adjacent feeder pick up unfaulted sections of the faulted feeder. Its value depends on how much load it can restore while the alternate source’s transformer and conductors stay within capacity and the far-end voltage stays within limits, weighed against the cost and fault exposure of any new tie line. In an illustrative comparison, candidate A could restore 2.0 MW but leaves 0.93 per unit at the far end, below a 0.95 limit, so in practice it restores less; candidate B restores 1.4 MW at 0.96 per unit with a shorter new tie. Expected restored energy, voltage, capacity margin and added exposure should be tabulated for each candidate on the same basis.
What a tie switch does
| Metric | A | B |
|---|---|---|
| Restorable by topology | 2.0 MW | 1.4 MW |
| Far-end voltage | 0.93 pu | 0.96 pu |
| New tie length | 1.2 km | 0.4 km |
| Alternate transformer loading | 98 % | 88 % |
When a section of feeder 1 is faulted and isolated, downstream unfaulted sections lose supply. A tie to feeder 2 at the end of those sections lets feeder 2 supply them. Automated restoration uses ties in the same way; see FLISR load-transfer checks must include transformer limits.
Evaluating candidates
Illustrative example. Two candidate tie locations between feeders 1 and 2; restoration assessed for a fault on feeder 1’s first section. Values chosen for demonstration.
| Metric | Candidate A | Candidate B |
|---|---|---|
| Load restorable by topology | 2.0 MW | 1.4 MW |
| Far-end voltage after transfer | 0.93 pu | 0.96 pu |
| Within limits | Partial | Full |
| New tie line length | 1.2 km | 0.4 km |
| Added fault exposure | Higher | Lower |
| Alternate transformer loading | 98 % | 88 % |
Candidate A’s nominal advantage disappears when voltage limits restrict how much can be transferred.
Constraints at transfer
- Alternate substation transformer capacity, including cold-load allowance; see cold-load pickup after a long outage.
- Conductor ratings on the alternate feeder path.
- Voltage at the new far end, with regulators and taps.
- Protection in the new configuration; see adaptive protection when a feeder is reconfigured.
Expected value
For each candidate, sum over credible fault locations:
- Probability of fault at each location (from outage history).
- Load restorable and duration saved.
- Expected restored energy or customer-minutes saved.
Compare with costs: switch, new line, automation, and added exposure of new line to faults.
Model checks
The model must not contain hidden parallel paths at existing normally open points; see normally open points without hidden parallel sources. Losses under normal configuration may change if the tie alters normal open points; see feeder reconfiguration for loss reduction.
What this article does not cover
It does not provide switching execution plans; those follow operating procedures.
Where this reasoning stops. Values are illustrative; evaluation needs load flow for each fault case.
Practical takeaway
Compare tie candidates by load restorable within capacity and voltage limits, expected restored energy across fault locations, and the cost and exposure of new tie lines, all on a common basis.
Reference framework
- IEEE 1366, Guide for electric power distribution reliability indices.