

Short answer
Transformer siting service reach is the route length over which low-voltage customers can be supplied within voltage-drop limits. It is not a geometric radius drawn around the site. Voltage drop depends on current, cable resistance and reactance, power factor and the length of the actual route along streets. In an illustrative 400 V three-phase supply with 95 mm² aluminium cable carrying 60 kW at 0.95 power factor at the end, the drop is about 52 V per km, so a 5 % limit of 20 V allows about 385 m of route. Loads spread along the cable rather than lumped at the end extend this. Route distance can be one and a half to two times straight-line distance in a street grid. Candidate sites should be compared by how many customers and how much load each can serve within limits, using actual routes and cable data.
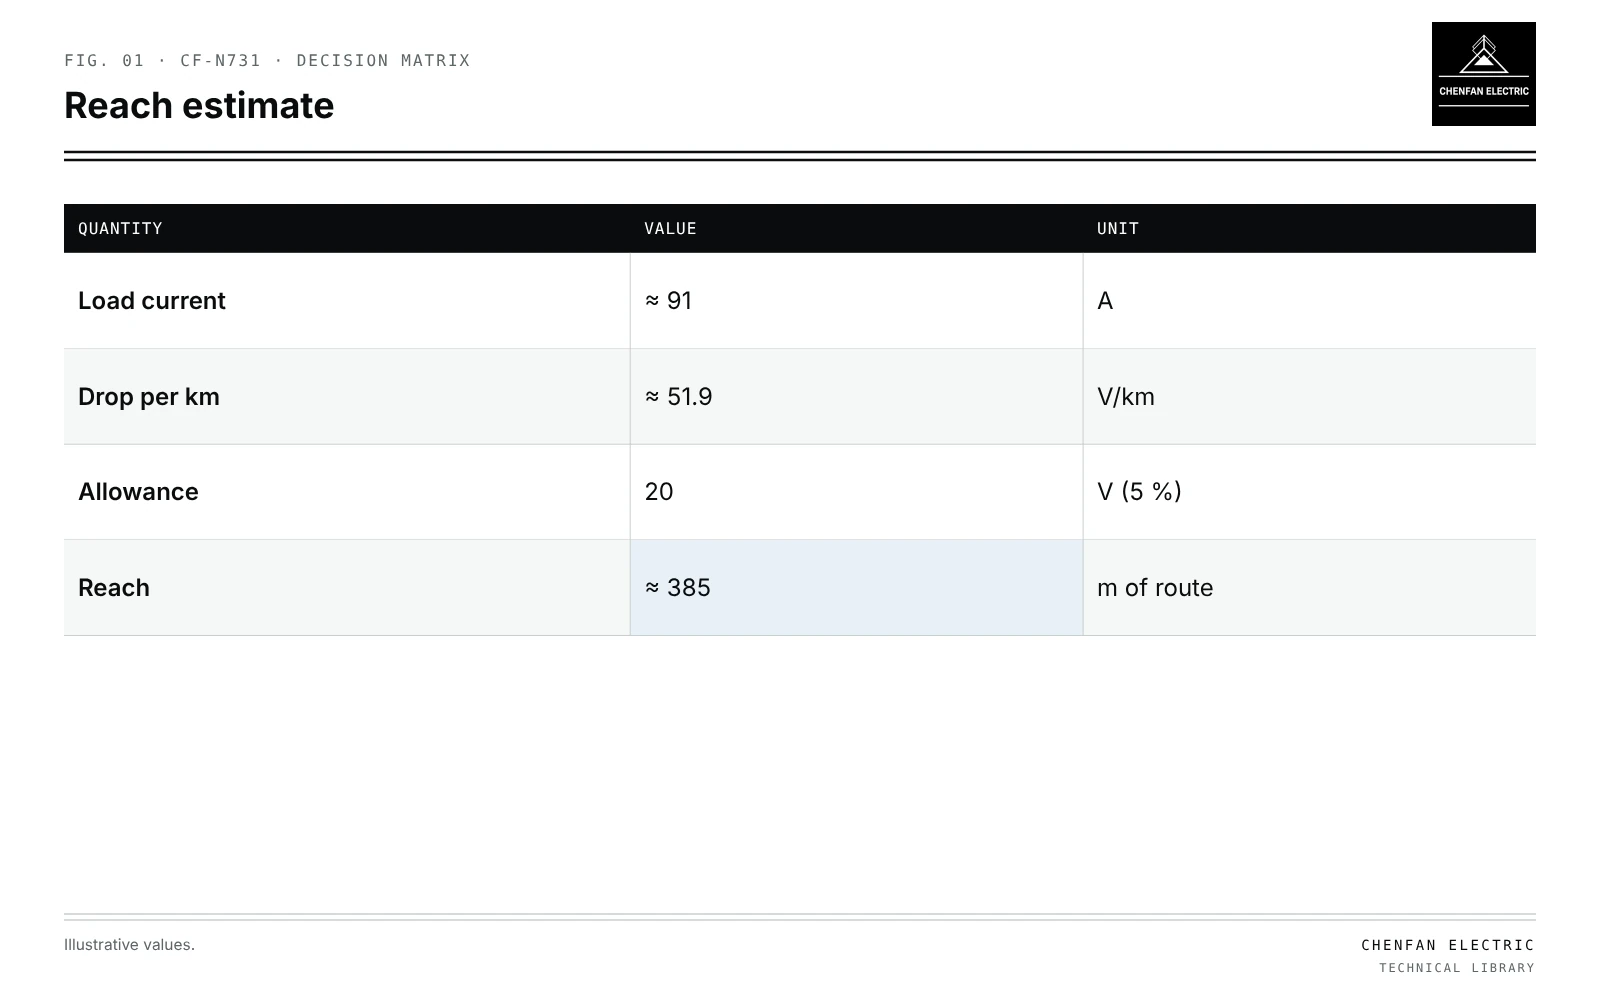
Voltage drop along a route
| Quantity | Value | Unit |
|---|---|---|
| Load current | ≈ 91 | A |
| Drop per km | ≈ 51.9 | V/km |
| Allowance | 20 | V (5 %) |
| Reach | ≈ 385 | m of route |
ΔU ≈ sqrt(3) × I × L × (R cos φ + X sin φ)
Illustrative example. 400 V three-phase; 95 mm² aluminium cable with R ≈ 0.32 Ω/km and X ≈ 0.08 Ω/km; lumped load 60 kW at 0.95 power factor at the end. Values chosen for demonstration.
I = 60,000 / (1.732 × 400 × 0.95) ≈ 91 A
ΔU per km ≈ 1.732 × 91 × (0.32 × 0.95 + 0.08 × 0.31) ≈ 51.9 V/km
With a 5 % (20 V) allowance for the LV cable:
Lmax ≈ 20 / 51.9 ≈ 0.385 km
What changes reach
| Factor | Effect on reach |
|---|---|
| Larger cable | Longer |
| Higher load | Shorter |
| Load distributed along route | About doubles for uniform load versus end load |
| Lower power factor | Shorter |
| Transformer voltage drop | Uses part of the allowance |
| Single-phase services | Shorter for same power |
The total voltage allowance must be split among MV, transformer and LV; see voltage measurements at different locations.
Geometric radius versus electrical end
- Straight-line circle includes customers whose route is far longer.
- Rivers, railways and private land break routes.
- Electrical end of the network is the customer with the largest drop, not the farthest point on the map.
Comparing candidates
- List candidate sites from screening; see locating distribution transformers with a load-centroid model.
- Trace routes to each customer.
- Calculate drop with planned cable sizes and loads, including growth.
- Count customers and load within limits for each site.
- Compare cost of cable, losses and land.
Future EV and heat pump load reduces reach; see planning transformer capacity with electrification scenarios. Sensitivity of results to load estimates is discussed in sensitivity ranking for planning inputs.
What this article does not cover
The load-centroid method for initial site selection is not repeated here.
Where this reasoning stops. Cable data are typical; use manufacturer values and actual installation conditions.
Practical takeaway
Define service reach by voltage drop along real routes, include load distribution, growth and the transformer’s own drop, and compare candidate sites by customers and load served within limits.
Reference framework
- IEC 60364-5-52, Low-voltage electrical installations: selection and erection of wiring systems (voltage drop).