

Do not set GOES scribing pitch equal to native domain width. The two spacings are measured in different directions, and no numerical equality between them establishes an optimum. Map the untreated domain structure, then select pitch from a controlled response curve that includes magnetic loss, excitation and coating condition. [1]
GOES scribing pitch works against a domain structure that varies with grain orientation and magnetic state. Laser-treated samples can show refined basic-domain spacing, but published experiments also show that closer lines do not guarantee lower loss. [1]
Measure the two spacings in their own directions
On the specimen map, mark rolling direction, scan direction and the direction used to measure native domain width. In a typical rolling-direction domain pattern, the basic 180° domain walls extend along the rolling direction and their separation is measured across it. Transverse scribing lines cross the rolling direction, while their pitch is measured along the rolling direction. These two lengths are orthogonal measurements, not interchangeable versions of the same spacing. [1]
Define the magnetic preparation and applied field for the untreated observations. Retain several fields of view and the distribution of measured widths rather than only a mean. Record grain boundaries and regions whose pattern cannot be resolved. A surface method describes its observed surface; it cannot silently become a complete bulk-domain inventory. Directional neutron imaging has shown that bulk-domain contrast also depends on specimen and measurement orientation. [1]
Follow the observed response, not a spacing match
The directly supported chain is narrower than a universal wall-motion model. In the cited experiment, laser treatment changed domain formation and measured hysteretic behaviour. The authors report residual-stress-induced domain refinement as the treatment mechanism, while noting that the detailed influence on bulk-domain behaviour was not fully understood. At the higher reported laser energy, visible lines and coating damage appeared; one close-spacing sample also had higher rather than lower loss.
This evidence changes the decision. Native domain mapping can identify material variation and confirm whether refinement occurred, but it does not supply the production pitch directly. Pitch must be tied to measured marginal response under documented material position, line-energy basis and magnetic test conditions.
Use pitch as an experimental variable
Choose candidate pitches within the equipment’s qualified trial capability and include untreated material from the same identified positions. The objective is to find an evidence-supported response range, not to assume that pitch should equal the native domain width.
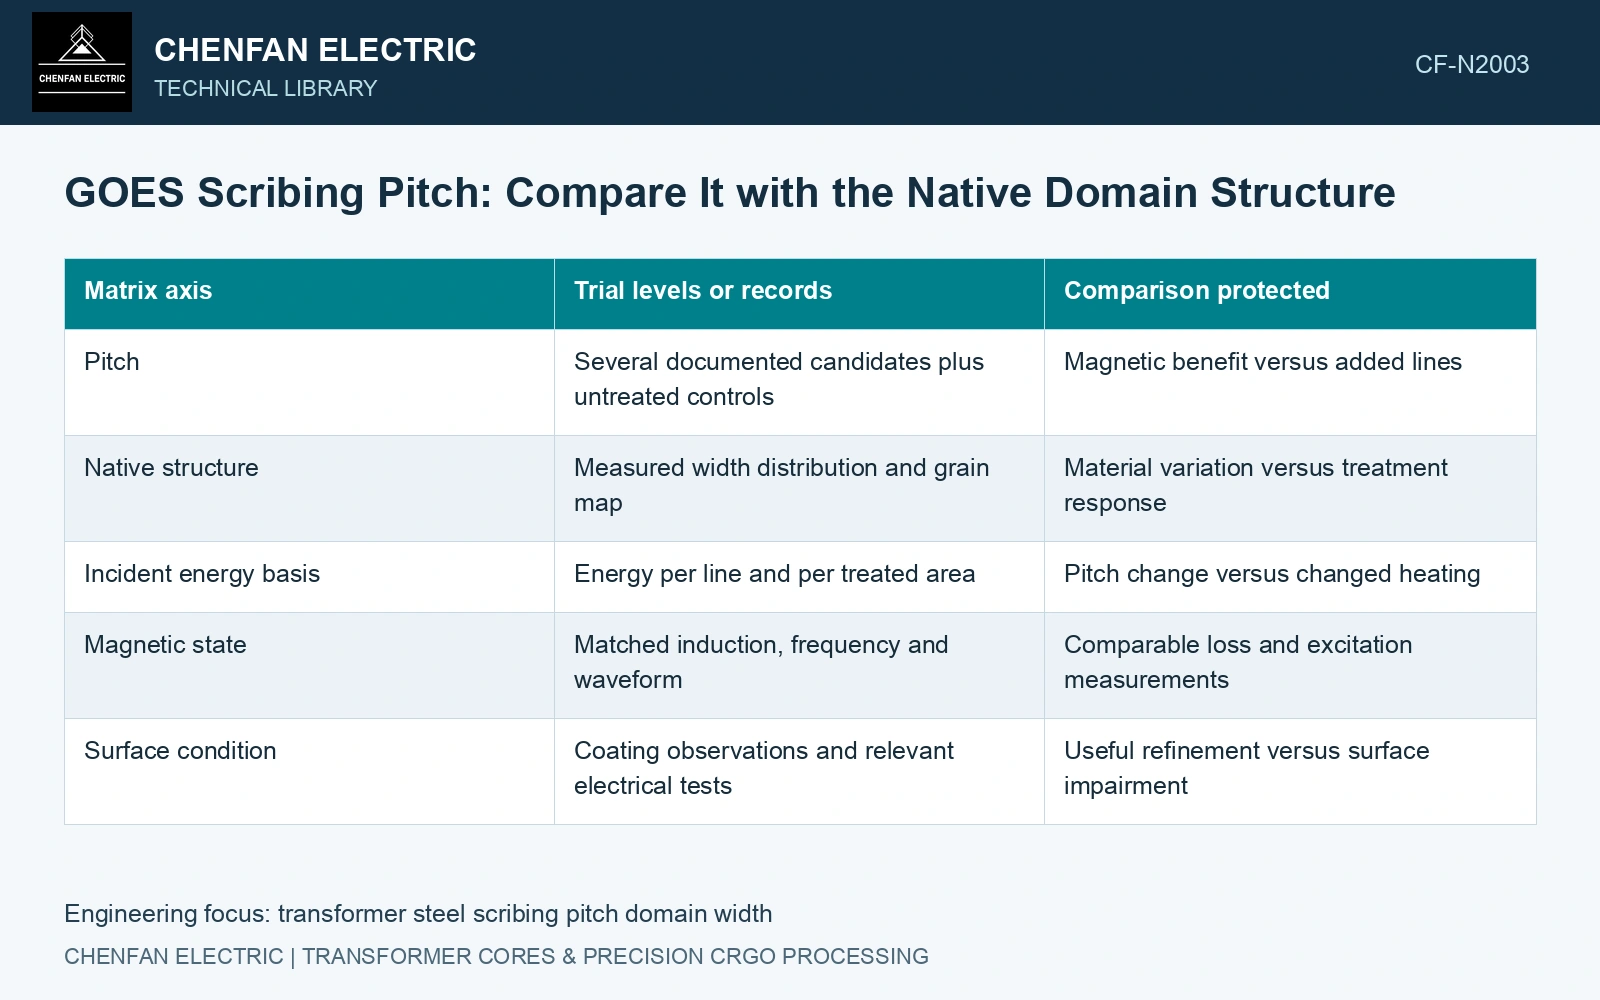
| Matrix axis | Trial levels or records | Comparison protected |
|---|---|---|
| Pitch | Several documented candidates plus untreated controls | Magnetic benefit versus added lines |
| Native structure | Measured width distribution and grain map | Material variation versus treatment response |
| Incident energy basis | Energy per line and per treated area | Pitch change versus changed heating |
| Magnetic state | Matched induction, frequency and waveform | Comparable loss and excitation measurements |
| Surface condition | Coating observations and relevant electrical tests | Useful refinement versus surface impairment |
For an idealised set of parallel continuous-wave lines, energy per unit line length is q = P/v. With line pitch p, the incident energy per treated area is:
EA = P / (vp) = q / p
Assumptions: laser power P = 1,000 W and scan speed v = 200 m/s. The energy per line length is 5 J/m. At a 4 mm pitch, the idealised incident energy is 1,250 J/m². Reducing pitch to 2 mm while holding power and speed fixed raises it to 2,500 J/m². The twofold increase does not prove greater absorption or better magnetic performance; it shows that pitch, line density and incident energy per area remain coupled. A trial must state which quantity is held fixed and report both energy bases.
Find the turning region in the measured response
Plot the paired loss difference against pitch, with uncertainty and material position visible. Put coating condition and excitation response on the same trial register. A loss difference smaller than the measurement uncertainty is unresolved, while a magnetic improvement accompanied by an unacceptable surface condition cannot establish a usable process.
One directional-neutron study tested 0.27 mm high-permeability GOES. Its B-H curves were measured at 50 Hz and 1.7 T. At the same reported 204 mJ laser energy, the 10 mm-line-distance sample showed a 10.6% core-loss reduction, whereas the 2 mm sample showed a −17.0% “reduction”—that is, an increase in loss. The table records visible lines and coating damage for both samples. These particular samples do not identify an optimum for another steel, but they directly reject a universal “closer lines, lower loss” rule. [1]
The Nippon catalogue distinguishes the preparation of its property-curve specimens: ORIENTCORE, HI-B and HI-B PM specimens receive stress-relief annealing, whereas HI-B LS specimens are wire-cut without it [2]. Preserve the purchased product and thermal state when comparing pitch. A response established before a later heat cycle cannot be transferred across that cycle without evidence for the specific domain-refinement route.
Track pitch, scan velocity, absorbed-energy state and cut/anneal history control the treatment response. Locate the usable region on matched material while retaining coating integrity and the eventual joint construction.
Ask the supplier to identify the region where an additional pitch reduction changes the outcome materially, and what consequence limits further reduction. That marginal comparison connects the selected spacing to native material variation, process energy and the actual magnetic duty the buyer needs.
References
- P. Rauscher et al., The influence of laser scribing on magnetic domain formation in grain oriented electrical steel visualized by directional neutron dark-field imaging, Scientific Reports 6, 38307, 2016, Table 1. DOI: 10.1038/srep38307.
- Nippon Steel Corporation, Grain-Oriented Electrical Steel Sheets, catalogue D004je, April 2020, specification and typical-property tables.