

Pulse landing positions reveal the energy pattern beneath a continuous-looking laser track. Calculate that geometry, then verify coating integrity, track continuity and magnetic response on the actual pulsed process. [1]
Calculate spacing before calling it overlap
For uniform scan speed v and pulse repetition frequency f, the centre-to-centre spacing is s = v/f. Use v in m/s and f in s⁻¹ to obtain metres. Let d be the along-scan footprint length under a stated optical threshold. A simple geometric overlap fraction is O = 1 − s/d when 0 ≤ s ≤ d. If s exceeds d, there is a geometric gap under that definition.
In an illustrative calculation, v = 1.5 m/s and f = 20,000 s⁻¹ give s = 0.075 mm. For d = 0.25 mm, O = 0.70. Pulse centres lie at 0, 0.075, 0.150 and 0.225 mm. Drawing a 0.25 mm interval around each centre shows why successive footprints intersect. These numbers illustrate the arithmetic; they are not a production recipe.
A Gaussian or other graded beam has no sharp physical edge at the chosen diameter. Seventy percent geometric overlap therefore does not mean seventy percent equal heating, damage or stress. The definition should remain attached to the result.
Keep the power ledger beside the landing map
If pulse energy is Ep in joules and repetition frequency is f, average incident power is Epf in watts, neglecting variations between pulses. Incident energy per scan length is Epf/v in J/m. Increasing frequency at unchanged pulse energy changes both overlap and average power. A trial that ignores this cannot isolate overlap as the cause of a magnetic change.
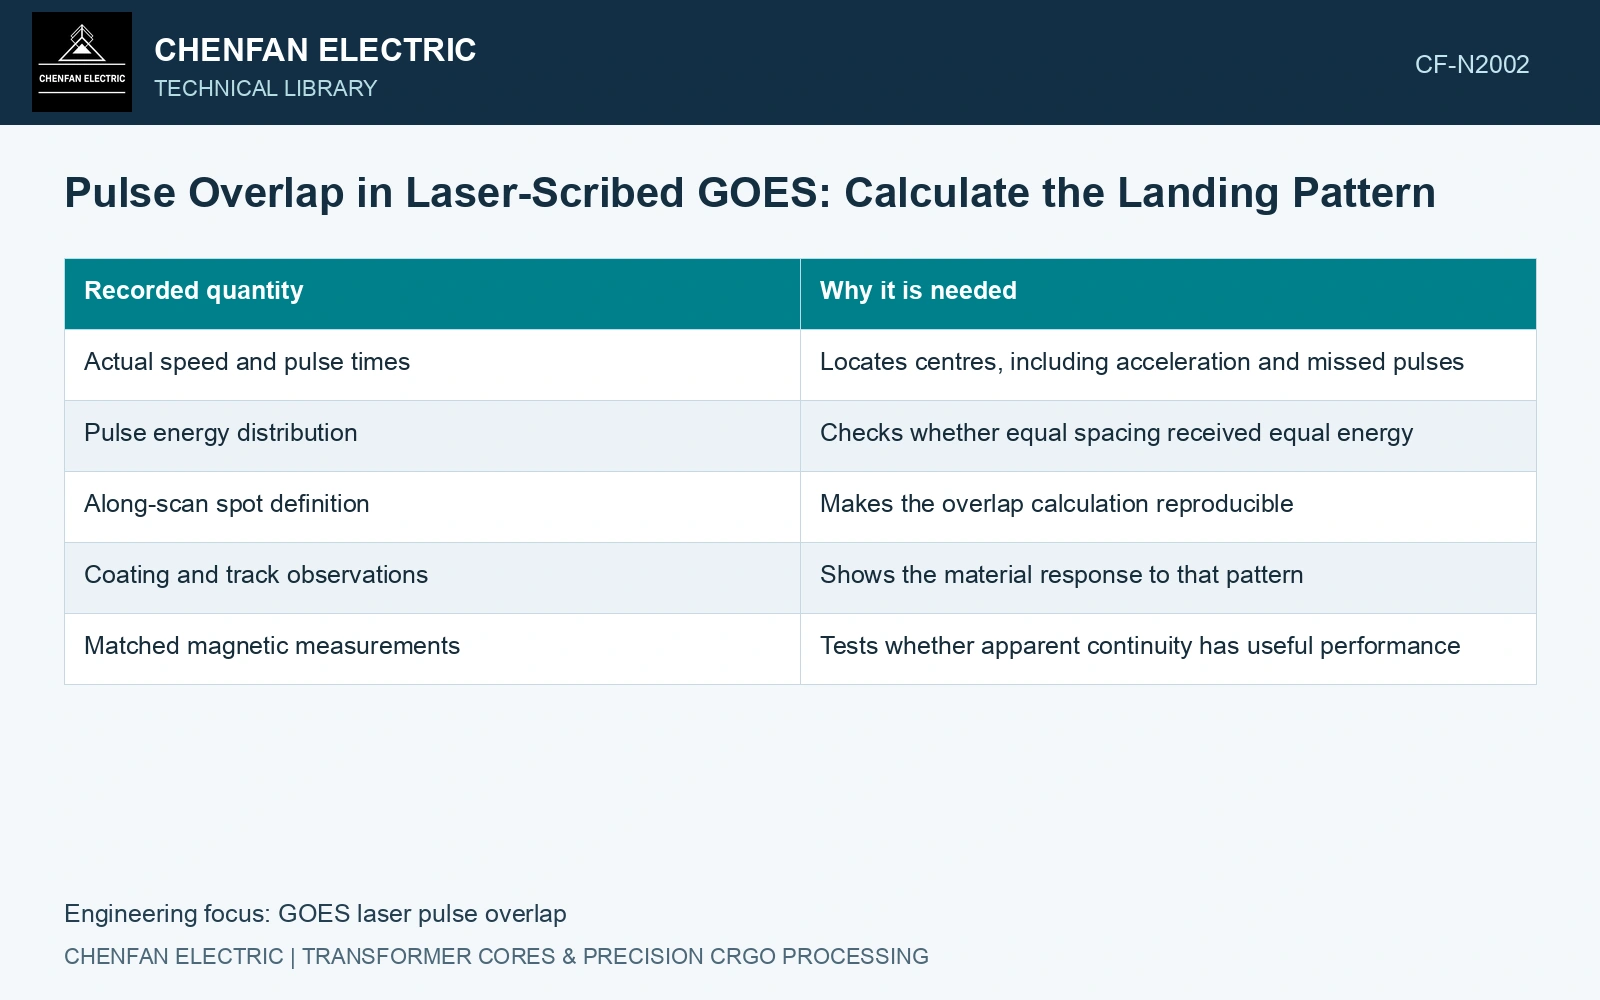
| Recorded quantity | Why it is needed |
|---|---|
| Actual speed and pulse times | Locates centres, including acceleration and missed pulses |
| Pulse energy distribution | Checks whether equal spacing received equal energy |
| Along-scan spot definition | Makes the overlap calculation reproducible |
| Coating and track observations | Shows the material response to that pattern |
| Matched magnetic measurements | Tests whether apparent continuity has useful performance |
Look for the expected periodicity
Register microscopy or other suitable surface observations to the scan coordinate. A recurring feature near the calculated spacing suggests a pulse-related pattern, but it does not uniquely identify the cause. Energy variation, motion and focus can produce related signatures. Synchronised process records distinguish those possibilities.
Catalogue 0.23 mm gauge and density 7,650 kg/m³ give an areal steel mass of 1.7595 kg/m². [2] Continue the assumed pulse example with 0.5 mJ per pulse at 20 kHz: average optical power is 10 W. At 1.5 m/s, line energy is 6.667 J/m; with an assumed 4 mm line pitch, incident energy is 1,666.7 J/m², or 947.24 J/kg. The geometric 70% footprint overlap therefore needs this separate energy account. Compare both when adjusting speed or repetition rate; equal overlap does not mean equal thermal exposure or magnetic refinement.
Pulse timing, measured scan velocity, focus and strip motion establish the landing map. Retain delivered power and line pitch as independent controlled parameters rather than qualifying treatment by overlap percentage alone.
Compare overlap conditions on paired material and record incident energy as a controlled quantity or an additional variable. Qualify the actual pulsed process on continuity, surface integrity and magnetic response; use the continuous-wave study for material context. [1]
References
- P. Rauscher et al., The influence of laser scribing on magnetic domain formation in grain oriented electrical steel visualized by directional neutron dark-field imaging, Scientific Reports 6, 38307, 2016, Table 1. DOI: 10.1038/srep38307.
- Nippon Steel Corporation, Grain-Oriented Electrical Steel Sheets, catalogue D004je, April 2020, specification and typical-property tables.