

Late PDC currents can be small enough that electrometer offset and thermal drift influence the apparent decay. A smooth trace is not proof that the signal comes entirely from insulation. Background must be characterized on the same relevant time scale.
Preserve current range, zeroing method, temperature and measurement duration. Use the instrument’s approved background and connection checks. Do not treat a momentary zero as evidence of zero drift for the following hours.
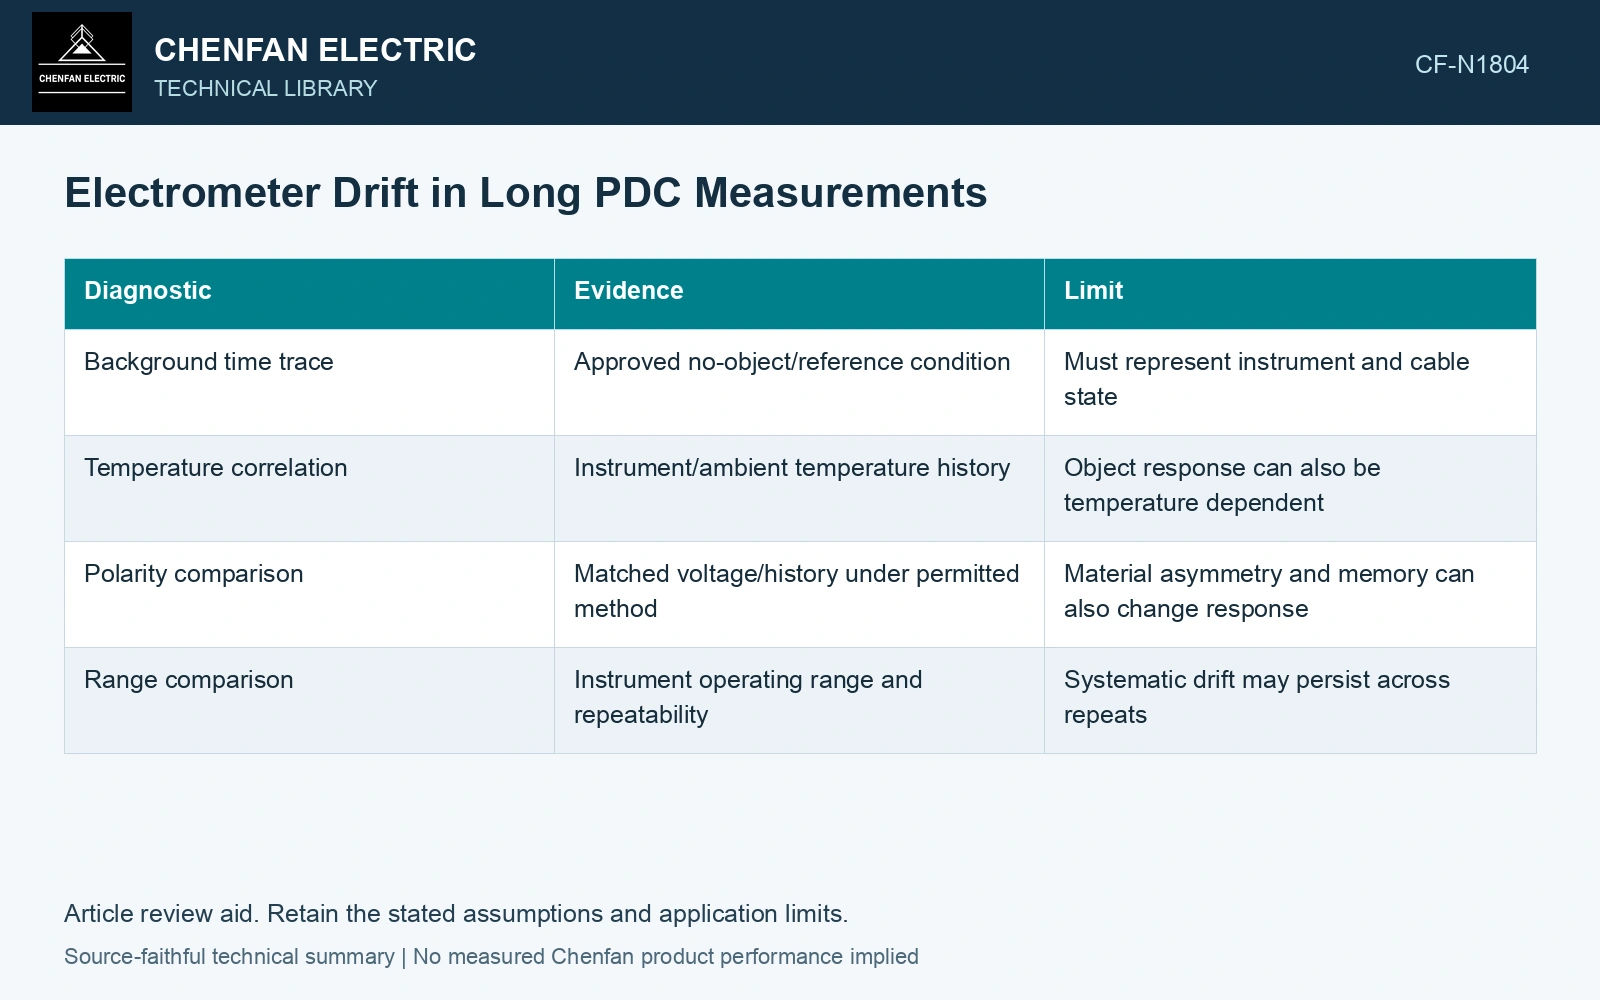
| Diagnostic | Evidence | Limit |
|---|---|---|
| Background time trace | Approved no-object/reference condition | Must represent instrument and cable state |
| Temperature correlation | Instrument/ambient temperature history | Object response can also be temperature dependent |
| Polarity comparison | Matched voltage/history under permitted method | Material asymmetry and memory can also change response |
| Range comparison | Instrument operating range and repeatability | Systematic drift may persist across repeats |
Bound a small difference
For a corrected signal i = imeas − ibg, independent standard uncertainties combine as ui = √(umeas² + ubg²). Correlated effects require covariance terms. All currents and uncertainties use amperes.
A corrected tail similar in magnitude to its uncertainty is poorly resolved. Raxsa and co-authors show why late-current fitting weights affect the resulting equivalent model; correcting raw background remains a separate measurement task. [1] Repetition can reduce random spread while a common drifting component remains. [2]
Combine standard uncertainties with covariance where effects are correlated; repeatability alone does not include all systematic contributions. [2]
Compare the corrected tail with its uncertainty
Assumptions at a matched late-time point and 20 °C: measured current is 8 pA with 1 pA standard uncertainty; representative background is 5 pA with 2 pA standard uncertainty, independent. Corrected current is 3 pA with uc = √(1² + 2²) = 2.236 pA. With assumed coverage factor 2, its interval is −1.472 to 7.472 pA and does not establish a resolved positive tail. Hold a high-weight material fit to that point until the background/time-temperature state is better characterized. The interval is a measurement-model result, not evidence of negative physical conduction. [2]
References
- J. Raxsa, P. Nimsanong, T. Mai-Eiam and P. Yutthagowith, Determination of Dielectric Models Based on Effective Multi-Exponential Fittings, Energies 16, 4615, 2023. DOI: 10.3390/en16124615.
- B. N. Taylor and C. E. Kuyatt, NIST Technical Note 1297, Guidelines for Evaluating and Expressing the Uncertainty of NIST Measurement Results, 1994, sections 5 and 6.