

At very low frequency, a measurement takes enough time for temperature, background current or the test environment to change. A plotted point can then combine dielectric response with drift. More low-frequency points are useful only when their signal and stability support the interpretation. [1]
Keep the time scale visible
A sinusoidal period is T = 1/f, with T in seconds and f in hertz. At an assumed 1 mHz, one cycle lasts 1,000 seconds. This arithmetic is not an averaging prescription: the approved method determines settling, acquisition and processing requirements.
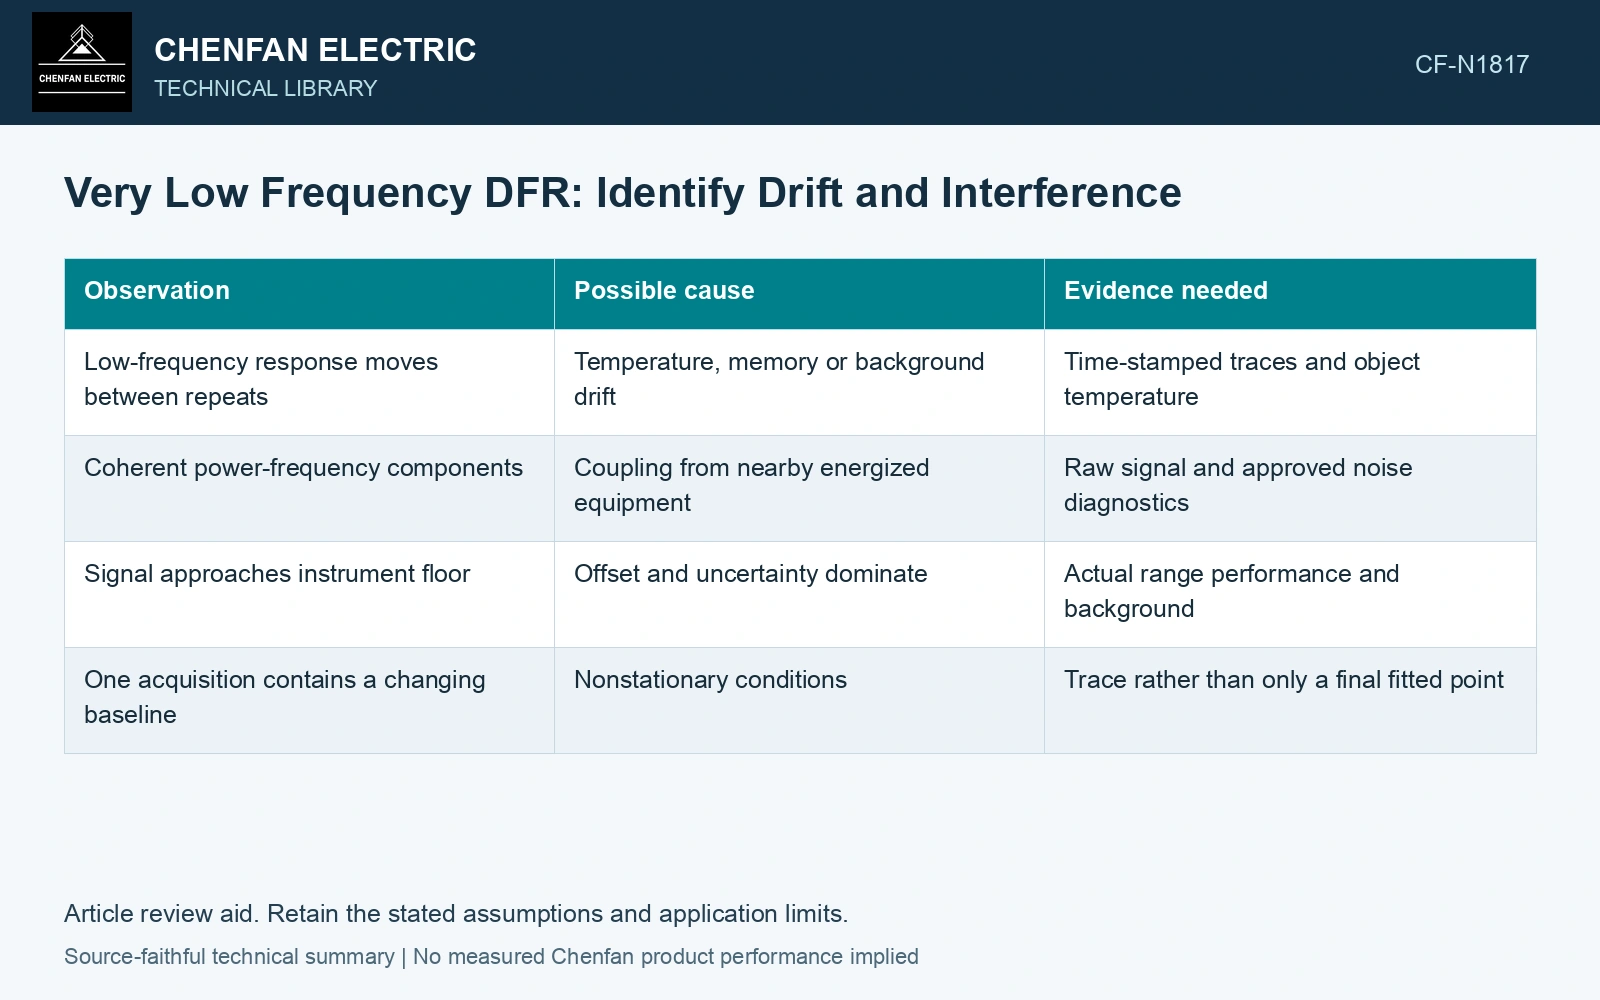
| Observation | Possible cause | Evidence needed |
|---|---|---|
| Low-frequency response moves between repeats | Temperature, memory or background drift | Time-stamped traces and object temperature |
| Coherent power-frequency components | Coupling from nearby energized equipment | Raw signal and approved noise diagnostics |
| Signal approaches instrument floor | Offset and uncertainty dominate | Actual range performance and background |
| One acquisition contains a changing baseline | Nonstationary conditions | Trace rather than only a final fitted point |
Use repeatability without erasing disagreement
Repeat measurements under comparable conditions and compare the raw signal and processed result. A repeated point that differs beyond uncertainty is evidence to investigate, not a reason to select whichever value produces a smoother moisture curve.
Approved guarding, connection and interference controls belong to the instrument procedure. Do not improvise earthing changes around a transformer merely to suppress a graph artifact.
Treat drift as an input to the actual measurement function. Its projection onto the reported phase components can differ from its raw span, so include the processing algorithm and baseline uncertainty when judging the point. [2]
Put drift on the measurement time scale
Assumptions: at 1 mHz and steady 20 °C, one 1,000 s cycle is processed by ideal sine/cosine projections 2/T∫i(t)sin(2πt/T)dt and 2/T∫i(t)cos(2πt/T)dt. The true response is 10 pA cosine, plus a linear baseline rising 2 pA over the cycle. The raw drift span is 20% of the response, but its sine projection is −2/π = −0.637 pA and its cosine projection is zero. It therefore creates a false quadrature component equal to 6.37% of the true amplitude. Against an assumed 5% cross-component error allocation, reject this point pending drift control/reprocessing. Apply the real instrument’s window and estimator rather than importing this ideal projection result. [2]
References
- IEEE, IEEE C57.161-2018, IEEE Guide for Dielectric Frequency Response Test.
- B. N. Taylor and C. E. Kuyatt, NIST Technical Note 1297, Guidelines for Evaluating and Expressing the Uncertainty of NIST Measurement Results, 1994, sections 5 and 6.