

Short answer
A resonance scan transformer damping model can change the answer several times over. The peak impedance of a parallel resonance between a capacitor bank and the supply is roughly the reactance at resonance times the circuit’s quality factor, and that quality factor depends on the resistance at the resonant frequency. Transformer resistance is not constant: eddy currents in windings and stray losses in structural parts make it rise with frequency. In an illustrative 1,000 kVA, 6 % transformer at 400 V with fundamental X/R of 6, resonating with capacitors at the 5th, a constant-resistance model gives a peak impedance of about 1.44 Ω; resistance rising with the square root of frequency gives about 0.64 Ω; resistance rising in proportion gives about 0.29 Ω. The resulting harmonic voltage from a 100 A injection ranges from about 144 V to 29 V. Scans must state the damping model and the frequency band in which it was validated.
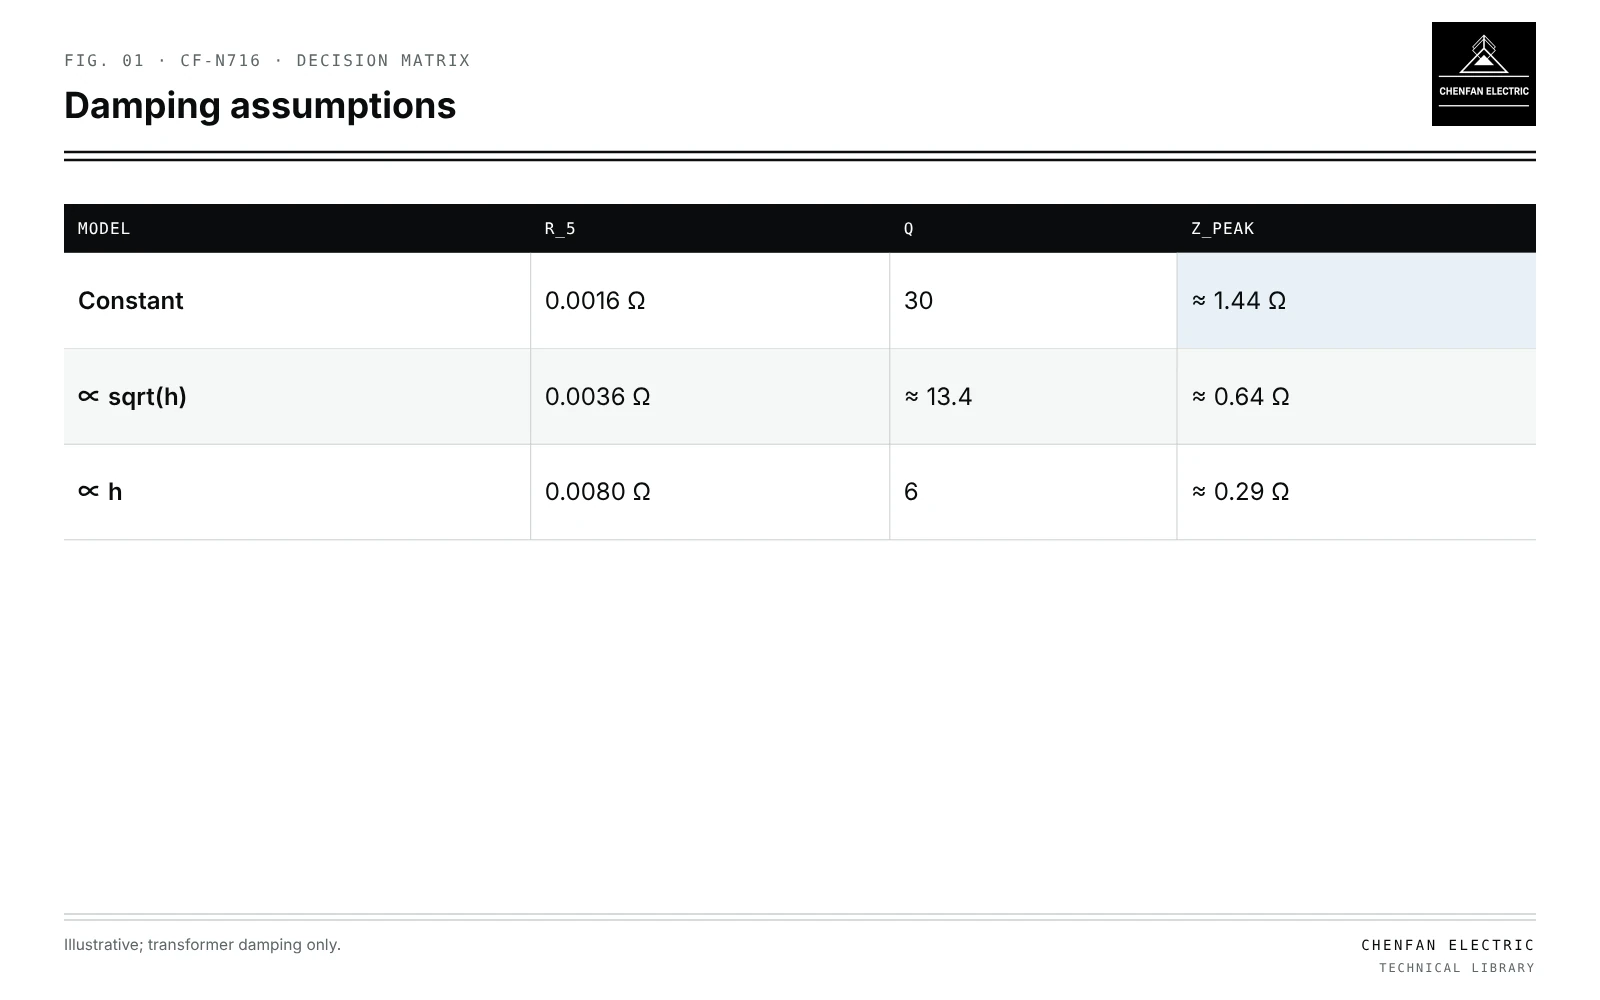
Peak impedance and Q
| Model | R_5 | Q | Z_peak |
|---|---|---|---|
| Constant | 0.0016 Ω | 30 | ≈ 1.44 Ω |
| ∝ sqrt(h) | 0.0036 Ω | ≈ 13.4 | ≈ 0.64 Ω |
| ∝ h | 0.0080 Ω | 6 | ≈ 0.29 Ω |
Zpeak ≈ Q × X_r, Q = X_r / R_h
X_r is the transformer (and source) reactance at the resonant harmonic, equal to the capacitor reactance there. R_h is the effective resistance at that harmonic, including transformer, source and load damping.
Illustrative damping cases
Illustrative example. 1,000 kVA, 6 % transformer at 400 V: fundamental impedance ≈ 0.0096 Ω, X/R = 6 so R_1 ≈ 0.0016 Ω; capacitors resonating at the 5th; source and load damping neglected. Values chosen for demonstration.
X_5 ≈ 5 × 0.0096 ≈ 0.048 Ω.
| Resistance model | R_5 | Q | Z_peak | V from 100 A |
|---|---|---|---|---|
| Constant | 0.0016 Ω | 30 | ≈ 1.44 Ω | ≈ 144 V |
| ∝ sqrt(h) | 0.0036 Ω | ≈ 13.4 | ≈ 0.64 Ω | ≈ 64 V |
| ∝ h | 0.0080 Ω | 6 | ≈ 0.29 Ω | ≈ 29 V |
The constant-resistance model is the most pessimistic and can lead to over-design or to false alarms; the proportional model may be optimistic. Actual behaviour lies within a band that depends on design.
Sources of frequency-dependent loss
- Winding eddy loss, rising with frequency squared at low frequencies, then more slowly as skin effect limits it.
- Stray loss in tank and clamps.
- Core loss at harmonic flux, small at harmonic voltages.
- Load damping, often larger than transformer damping; resistive loads damp strongly, drives with constant-power front ends very little.
Model validation
- Frequency response measurements of the transformer or similar units.
- Measured bus impedance at harmonic frequencies, from injection or switching events.
- Comparison of scan predictions with measured harmonic voltages under known load.
The model should be marked valid only within the band where it was compared with measurements. Supraharmonic behaviour is different again; see supraharmonic coupling through distribution transformers.
Use in design
Run scans with a range of damping assumptions for capacitor and filter design; see harmonic amplification after one transformer is removed, tolerance drift in tuned harmonic filters and capacitor overload from background harmonics.
What this article does not cover
The general data list for harmonic modelling is not repeated here.
Where this reasoning stops. Exponents are illustrative bounds; real resistance curves come from measurement or detailed design data.
Practical takeaway
Model transformer resistance as frequency-dependent, run scans across plausible damping assumptions, include load damping, and state the band in which the model was validated.
Reference framework
- IEEE 519, Standard for harmonic control in electric power systems.