

Short answer
Transformer probabilistic hosting capacity studies estimate how much distributed generation can connect before limits are exceeded, accounting for uncertainty in where systems will be installed and how large they will be. Many placement scenarios are sampled; each is run against the transformer and feeder constraints, usually with time-series load and generation. Irradiance is strongly correlated across a single transformer’s service area, so PV output must not be sampled independently for each customer. The limiting case is often reverse loading of the transformer at midday minimum load, together with voltage rise at the far end. In an illustrative study of 1,000 placements, hosting capacity is about 320 kW at the 5th percentile, 450 kW median and 600 kW at the 95th. Results should be reported as distributions, conditioned on stated assumptions and limits; there is no single regional PV share that applies everywhere.
What is random and what is not
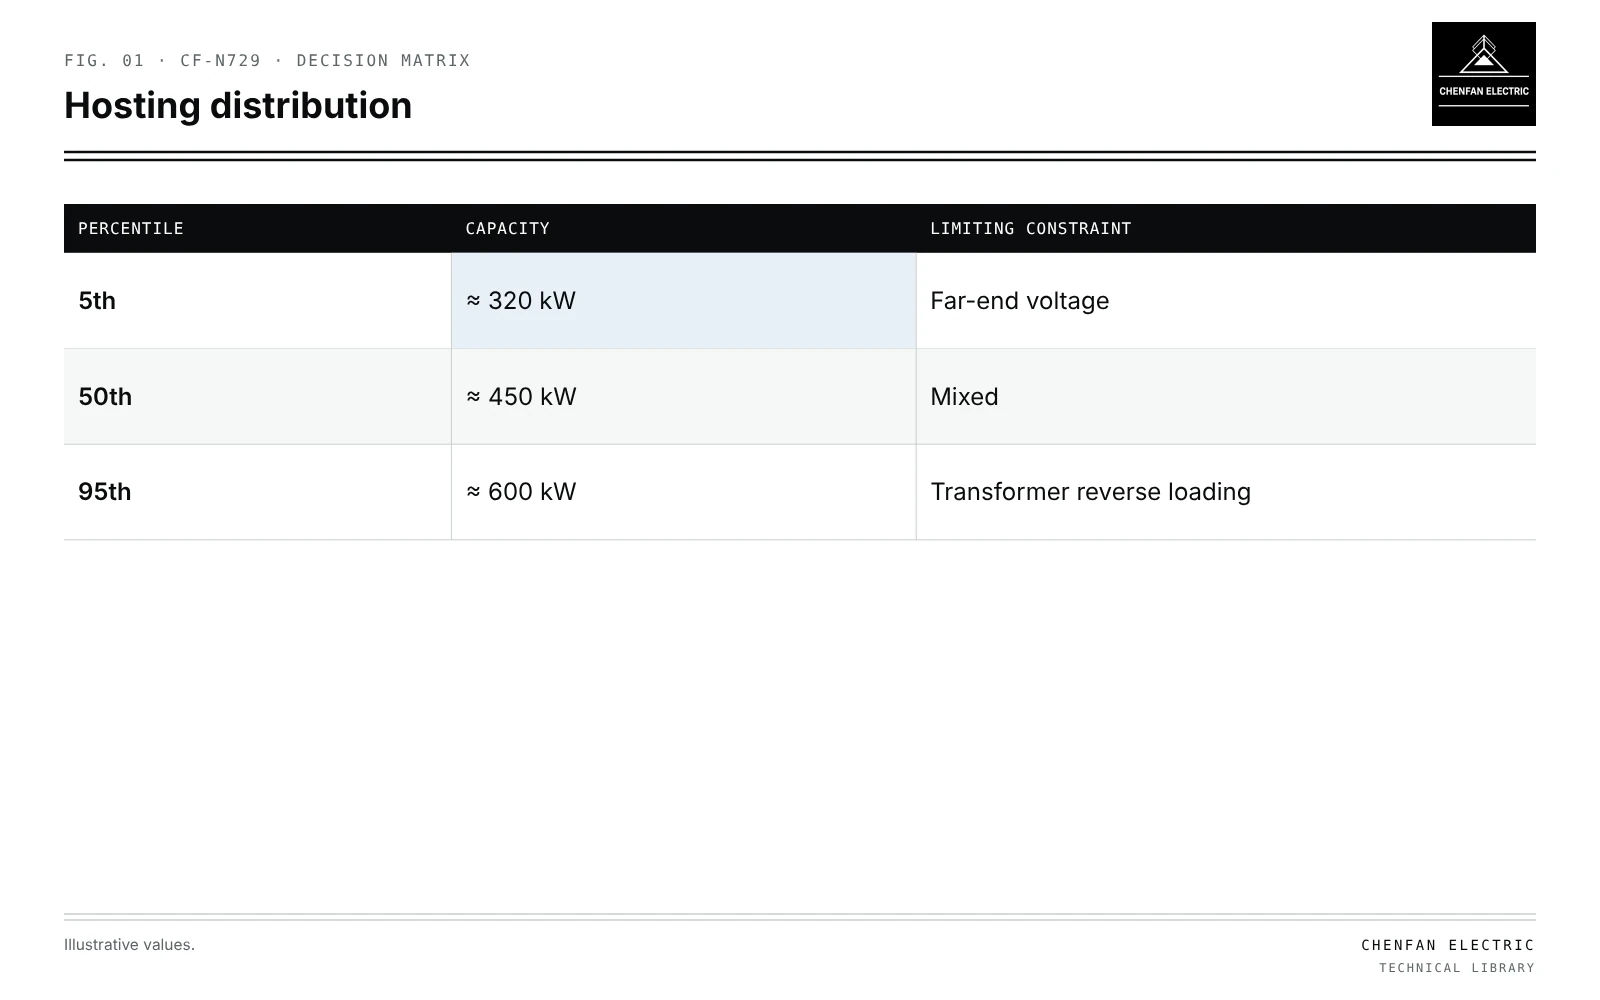
| Percentile | Capacity | Limiting constraint |
|---|---|---|
| 5th | ≈ 320 kW | Far-end voltage |
| 50th | ≈ 450 kW | Mixed |
| 95th | ≈ 600 kW | Transformer reverse loading |
| Quantity | Treatment |
|---|---|
| PV location | Random among eligible customers |
| PV size | Random within realistic distribution |
| Irradiance | Shared, correlated across the area |
| Load | Time series, correlated with weather and season |
| Transformer and network | Fixed, calibrated model |
Independent sampling of irradiance per customer averages out variability and overstates hosting capacity.
Constraints
- Transformer loading: forward and reverse, against continuous and emergency ratings and their duration.
- Voltage: maximum at customer points; see LV feeder voltage sensitivity.
- Thermal limits of LV cables.
- Protection effects such as blinding; see protection blinding from downstream inverter sources.
- Unbalance if PV is single-phase.
Separating probabilistic limits (for example, voltage above limit in less than 1 % of hours) from deterministic limits (never exceed emergency rating) must be explicit.
Illustrative result
Illustrative example. 1,000 random placements of PV on customers of one 500 kVA transformer; year-long QSTS each; limits: reverse loading ≤ 100 % and customer voltage ≤ 1.05 pu. Values chosen for demonstration.
| Percentile | Hosting capacity |
|---|---|
| 5th | ≈ 320 kW |
| 50th | ≈ 450 kW |
| 95th | ≈ 600 kW |
Low values come from placements clustered at the far end of a long LV feeder, where voltage limits first; high values from PV near the transformer, where reverse loading limits first.
Reporting
- Distribution of hosting capacity, not a single number.
- Limiting constraint for each percentile.
- Assumptions: load data, PV size distribution, inverter settings.
- Conditions: results valid for this network and these assumptions only.
QSTS method is described in quasi-static time-series studies; scenario consistency in Monte Carlo load scenarios without impossible combinations; EV loads that may offset PV in correlated EV charging loads.
What this article does not cover
It does not claim any uniform PV penetration percentage that applies across a region.
Where this reasoning stops. Percentiles are illustrative; real results depend on network and data.
Practical takeaway
Sample PV placement and size, keep irradiance and load correlation, check transformer reverse loading and voltage together, and report hosting capacity as a conditional distribution with its limiting constraints.