

A total core-loss measurement combines heating throughout the measured assembly. A small abnormal source can fall within the comparison’s uncertainty or ordinary variation while still concentrating power in a small, weakly cooled region. A normal total result does not establish that every local contact is thermally acceptable.
The useful question is quantitative in structure: could the suspected source be detected by the aggregate measurement, and what temperature response could its local thermal path create? Those are separate sensitivity questions.
State what normal means in the loss test
Record the actual excitation, temperature, assembly condition and comparison reference. Distinguish display resolution from measurement uncertainty and repeatability. A finely displayed watt value can still have a much larger uncertainty in the difference between two assembly states.
Let Delta P be the additional local power in watts and U_difference the justified uncertainty of the total-power comparison in watts. If Delta P is small relative to U_difference, the aggregate comparison may not resolve it. This is a detectability statement, not a permissible-defect criterion.
State what controls the local temperature
For an illustrative steady lumped source with a linear thermal path, Delta T = Delta P R_theta. Temperature rise is in kelvins and thermal resistance R_theta is in kelvins per watt. The relation applies only where that simplified thermal representation is adequate.
A localized source can have a thermal resistance different from the overall core’s average. Surface temperature may also differ from the source temperature. Identify the path and observation region before using a temperature trace to infer local power or risk.
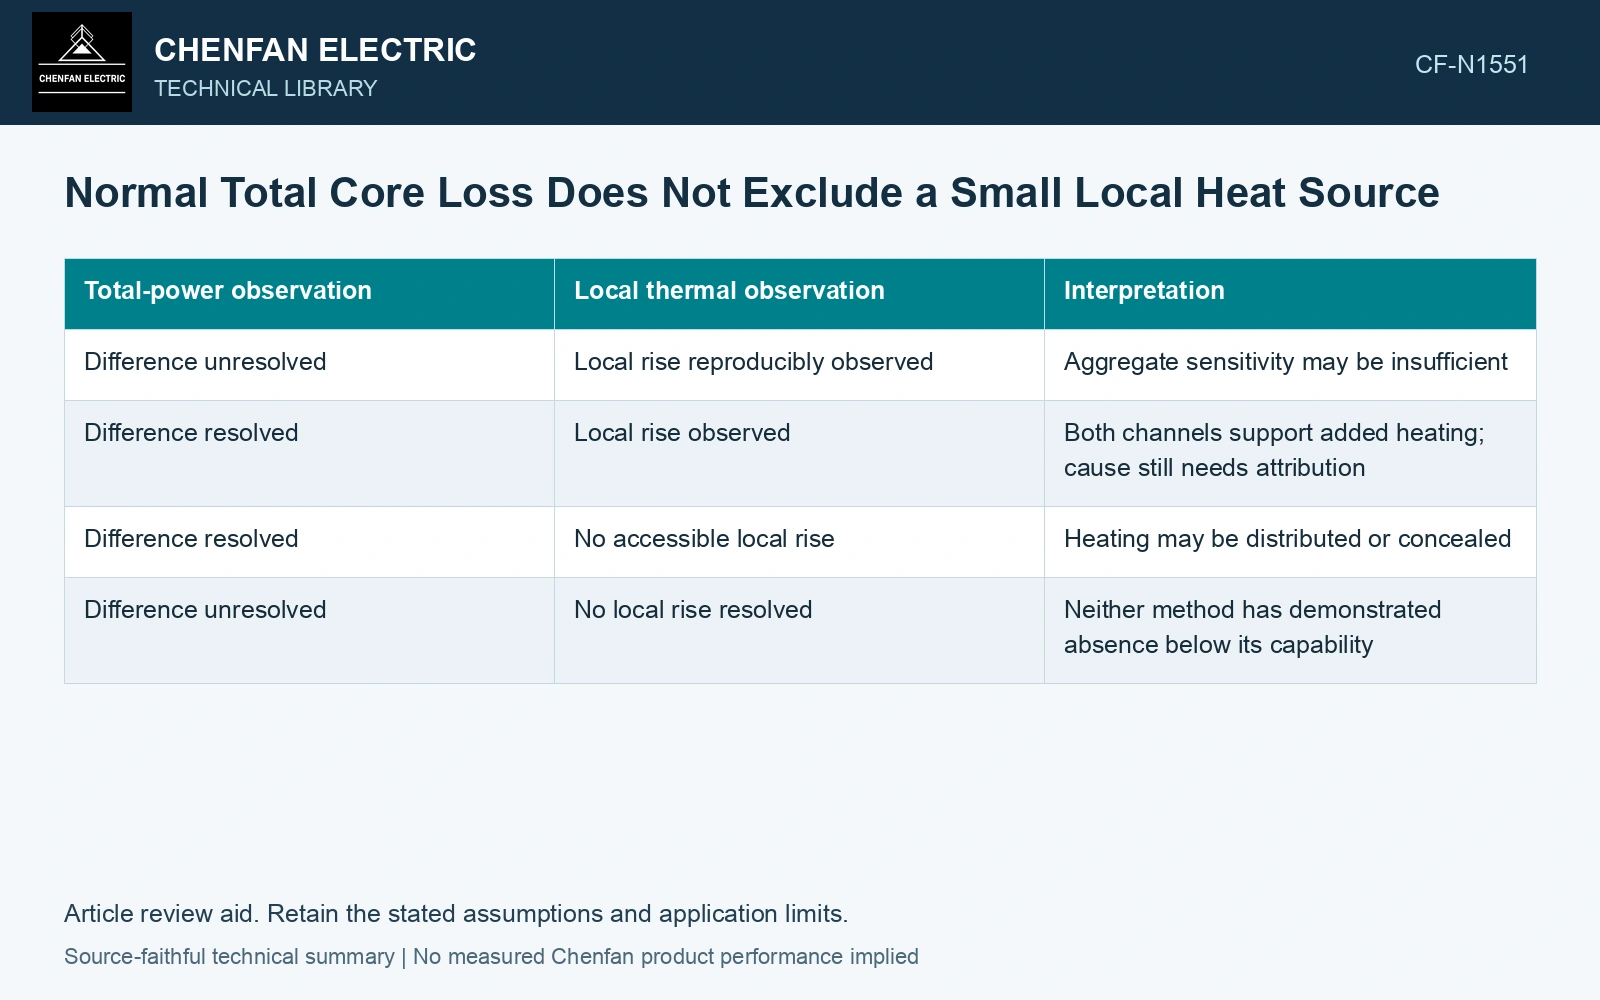
| Total-power observation | Local thermal observation | Interpretation |
|---|---|---|
| Difference unresolved | Local rise reproducibly observed | Aggregate sensitivity may be insufficient |
| Difference resolved | Local rise observed | Both channels support added heating; cause still needs attribution |
| Difference resolved | No accessible local rise | Heating may be distributed or concealed |
| Difference unresolved | No local rise resolved | Neither method has demonstrated absence below its capability |
The last case is especially easy to overstate. Two negative observations can share blind regions or lack the required sensitivity.
Select a complementary observation
Choose local thermal or electromagnetic measurements that address the proposed contact and preserve its assembly state. Check thermographic emissivity and reflections, probe placement and accessibility. A local measurement is useful only if its own false-positive and missed-detection mechanisms are understood. [1]
Compare repeated and controlled states where professional test procedures permit. A hotspot that changes with a contact-state hypothesis is more informative than one unregistered image. Retain the electrical path evidence separately from the temperature evidence.
The acceptance investigation should therefore use the total-loss result for the quantity it actually measures and local evidence for the localized question. A normal aggregate test can support overall magnetic performance while leaving a specific contact-heating hypothesis unresolved. The two conclusions are compatible and should remain distinct in the disposition.
Compare catalogue-scale loss with a local thermal increment
For 23ZH90, the catalogue guaranteed specific loss is at most 0.90 W/kg at 1.7 T and 50 Hz on longitudinal specimens after stress-relief annealing [2]. Assume 1,000 kg of that material: multiplying gives a 900 W material comparison scale, not an assembled-core guarantee. Assume a 2.0 W local source, total-loss difference expanded uncertainty of 5.0 W, and a linear local thermal resistance of 10 K/W. The source is only 0.22% of the 900 W scale and below the assumed aggregate uncertainty, yet gives a modelled local rise of 20 K. Investigate locally rather than treating the unresolved power increment as zero [3].
Manufacturing controls. Burr bridges, coating integrity, clamp contact, packet pressure and cooling-duct access determine local sources and heat removal. Catalogue strip loss helps select material; assembled-core loss and local heating require their own measurements.
References
- Deisenroth, D. C. et al., Measurement Uncertainty of Surface Temperature Distributions for Laser Powder Bed Fusion Processes, Journal of Research of NIST 126, 126013, 2021, sections 1.5 and 2.1; DOI: 10.6028/jres.126.013.
- Nippon Steel Corporation, Grain-Oriented Electrical Steel Sheets, catalogue D004je_03_202004, 2020, Specifications; Size and Form Tolerances.
- JCGM, JCGM 100:2008, Evaluation of measurement data — Guide to the expression of uncertainty in measurement, 2008.