

Short answer
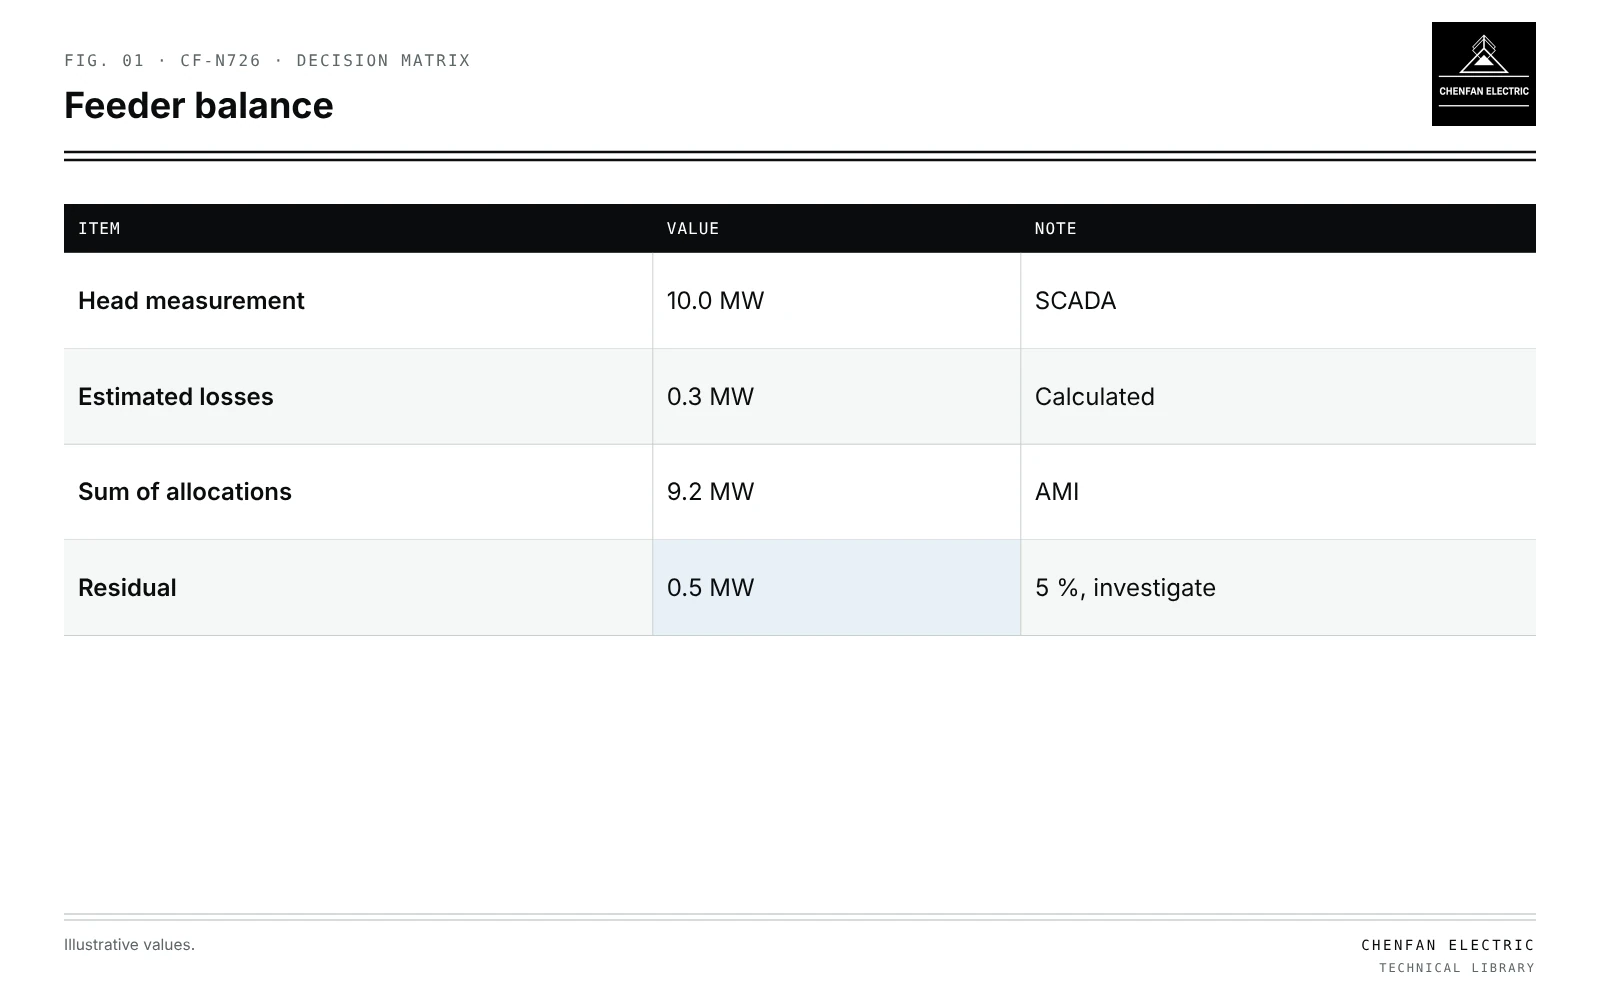
Transformer load allocation AMI calibration sums the interval readings of every customer meter linked to a transformer to build that transformer’s load profile. The result is only as good as three things: the customer-to-transformer links, the time alignment of meter intervals, and the handling of missing reads. Comparing the summed allocations with upstream measurements tests all three. In an illustrative feeder, the head measures 10.0 MW at peak, estimated losses are 0.3 MW and the sum of transformer allocations is 9.2 MW, leaving 0.5 MW, about 5 %, unexplained. That residual points to unlinked customers, unmetered loads such as street lighting, wrong links to a neighbouring feeder or clock errors. Where line sensors exist, comparing by section narrows the search. Calibration should correct identified errors, not scale all transformers to force a match.
Building transformer profiles
| Item | Value | Note |
|---|---|---|
| Head measurement | 10.0 MW | SCADA |
| Estimated losses | 0.3 MW | Calculated |
| Sum of allocations | 9.2 MW | AMI |
| Residual | 0.5 MW | 5 %, investigate |
- Link each meter to its transformer, from GIS and field data; see transformer phase mapping in GIS-to-power-flow conversion.
- Align intervals: meters may report at different times or with clock drift.
- Handle gaps: missing intervals estimated with flags, not silently zeroed.
- Sum to transformer level, including losses of service drops if significant.
Comparing with upstream data
Illustrative example. Feeder peak hour: head measurement 10.0 MW; estimated technical losses 0.3 MW; sum of transformer allocations 9.2 MW. Values chosen for demonstration.
residual = 10.0 − 0.3 − 9.2 = 0.5 MW (5 %)
| Possible cause | Check |
|---|---|
| Customers not linked | Meters without transformer ID |
| Unmetered loads | Street lighting, traffic signals |
| Links to wrong feeder | GIS boundary errors |
| Clock offset | Peak timing differences |
| Loss estimate error | Recompute losses |
Section-level comparison
Line sensors or recloser measurements split the feeder into sections. Residuals by section show where mapping errors concentrate. A section with a large residual and few customers may contain unlinked transformers. Reconciliation methods are covered in reconciling feeder-head measurements with transformer-level estimates.
Calibration, not forcing
The aim is a model that explains measurements, not one that merely matches them.
- Correct links, add unmetered loads and fix clocks where found.
- Leave remaining residuals visible, with their size and uncertainty.
- Avoid scaling every transformer by the same factor to match the head; this hides errors and distorts individual transformer loading.
Uses
- Transformer loading assessment and replacement planning; see planning transformer capacity with electrification scenarios.
- Loss analysis; see technical and nontechnical losses at a distribution transformer.
- Time-series studies; see quasi-static time-series studies.
What this article does not cover
Algorithms for identifying customer phases are not repeated here.
Where this reasoning stops. Residual causes are typical examples; investigation determines the real ones.
Practical takeaway
Build transformer profiles from correctly linked, time-aligned meter data with transparent gap handling, compare with upstream measurements by section, and correct identified errors rather than scaling to force a match.