

Time-domain and frequency-domain dielectric methods probe related response in a linear, stable system. Finite measurements cover limited windows, however, and a transformation needs assumptions about behavior outside them. A computed spectrum is not entirely measured evidence. [1]
State the system assumptions
Converting a response between domains generally relies on a consistent linear time-invariant representation and compatible initial conditions. Temperature drift, voltage dependence or changing material state can break that premise. Compare the same insulation boundary and material condition.
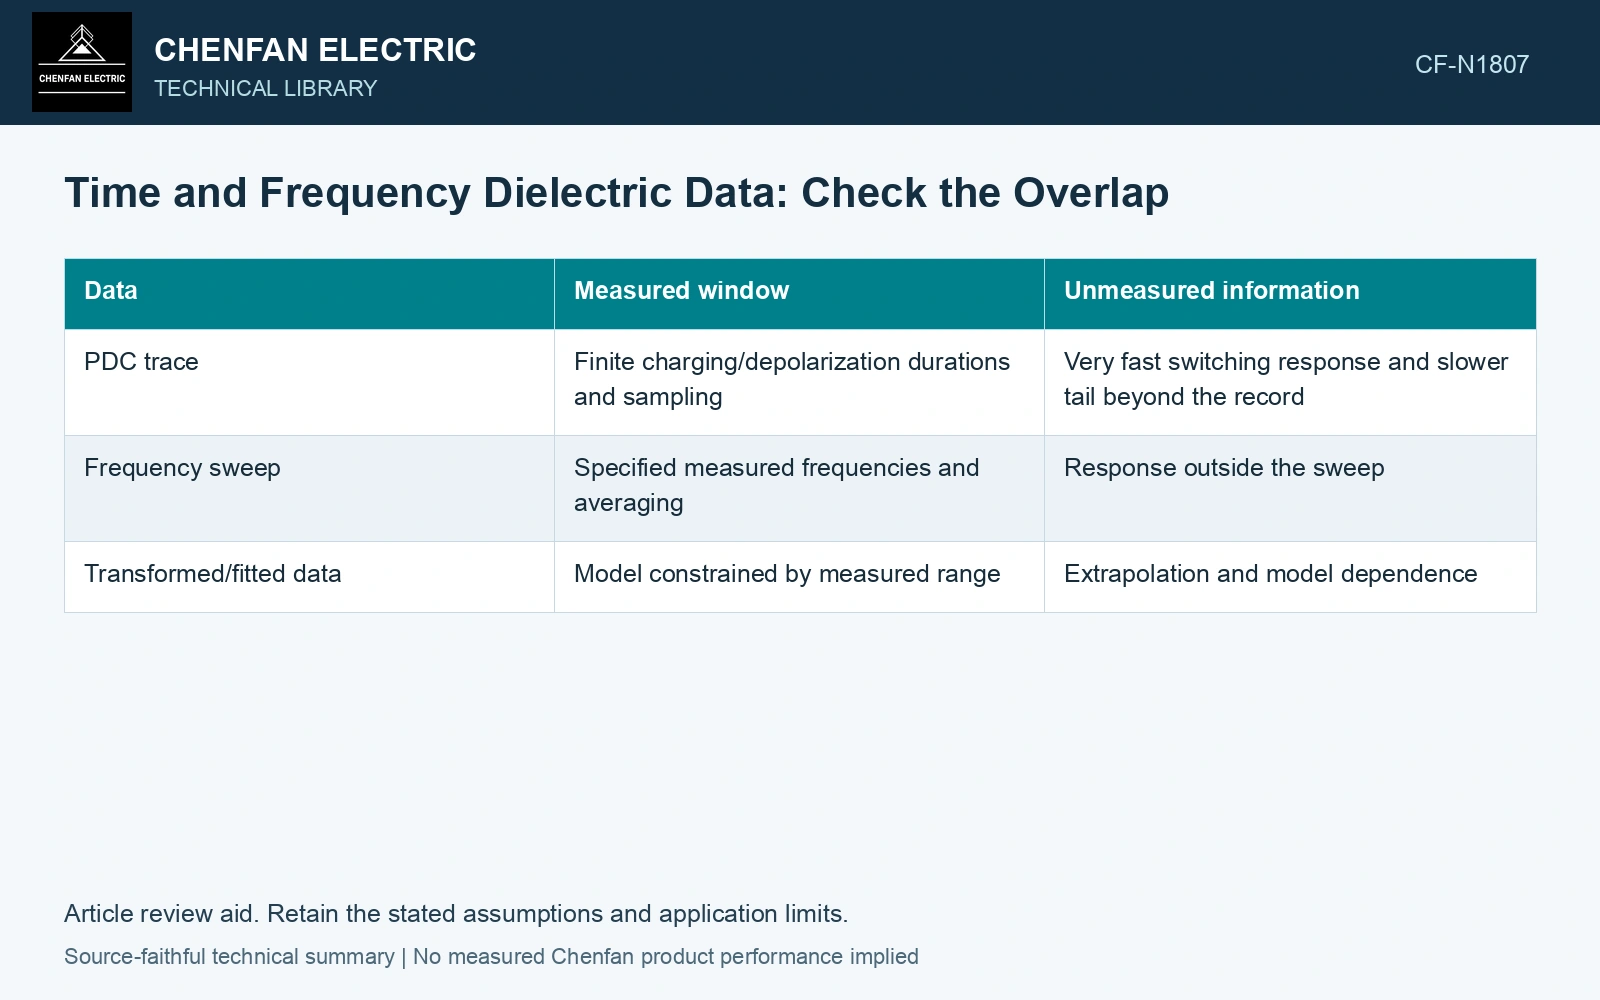
| Data | Measured window | Unmeasured information |
|---|---|---|
| PDC trace | Finite charging/depolarization durations and sampling | Very fast switching response and slower tail beyond the record |
| Frequency sweep | Specified measured frequencies and averaging | Response outside the sweep |
| Transformed/fitted data | Model constrained by measured range | Extrapolation and model dependence |
Use time-frequency scale as an orientation
A relaxation time τ is associated with a characteristic frequency near 1/(2πτ) in a simple single-time-constant model. Seconds and hertz are reciprocal through this relation. It is not an exact conversion from every measurement time point to one frequency point in a broad dielectric response.
Compare overlapping regions after applying a qualified transformation or shared model. Retain residuals and uncertainty. A discrepancy may reveal insufficient window, initial memory or a material/model mismatch rather than a failure of one instrument.
Raxsa and co-authors derive frequency response from an extended Debye model fitted to a finite depolarization record. Keep the measured window separate from the equivalent’s prediction, especially for a relaxation peak outside the frequency sweep. [2]
Compare time and frequency windows explicitly
Assume a single relaxation time of 100 s. Its characteristic frequency is 1/(2π×100) = 1.592 mHz. A frequency sweep beginning at 10 mHz does not directly cover that feature. Preserve any extrapolated portion as model output and compare measured overlap before combining datasets.
References
- IEEE, IEEE C57.161-2018, IEEE Guide for Dielectric Frequency Response Test.
- J. Raxsa, P. Nimsanong, T. Mai-Eiam and P. Yutthagowith, Determination of Dielectric Models Based on Effective Multi-Exponential Fittings, Energies 16, 4615, 2023. DOI: 10.3390/en16124615.