

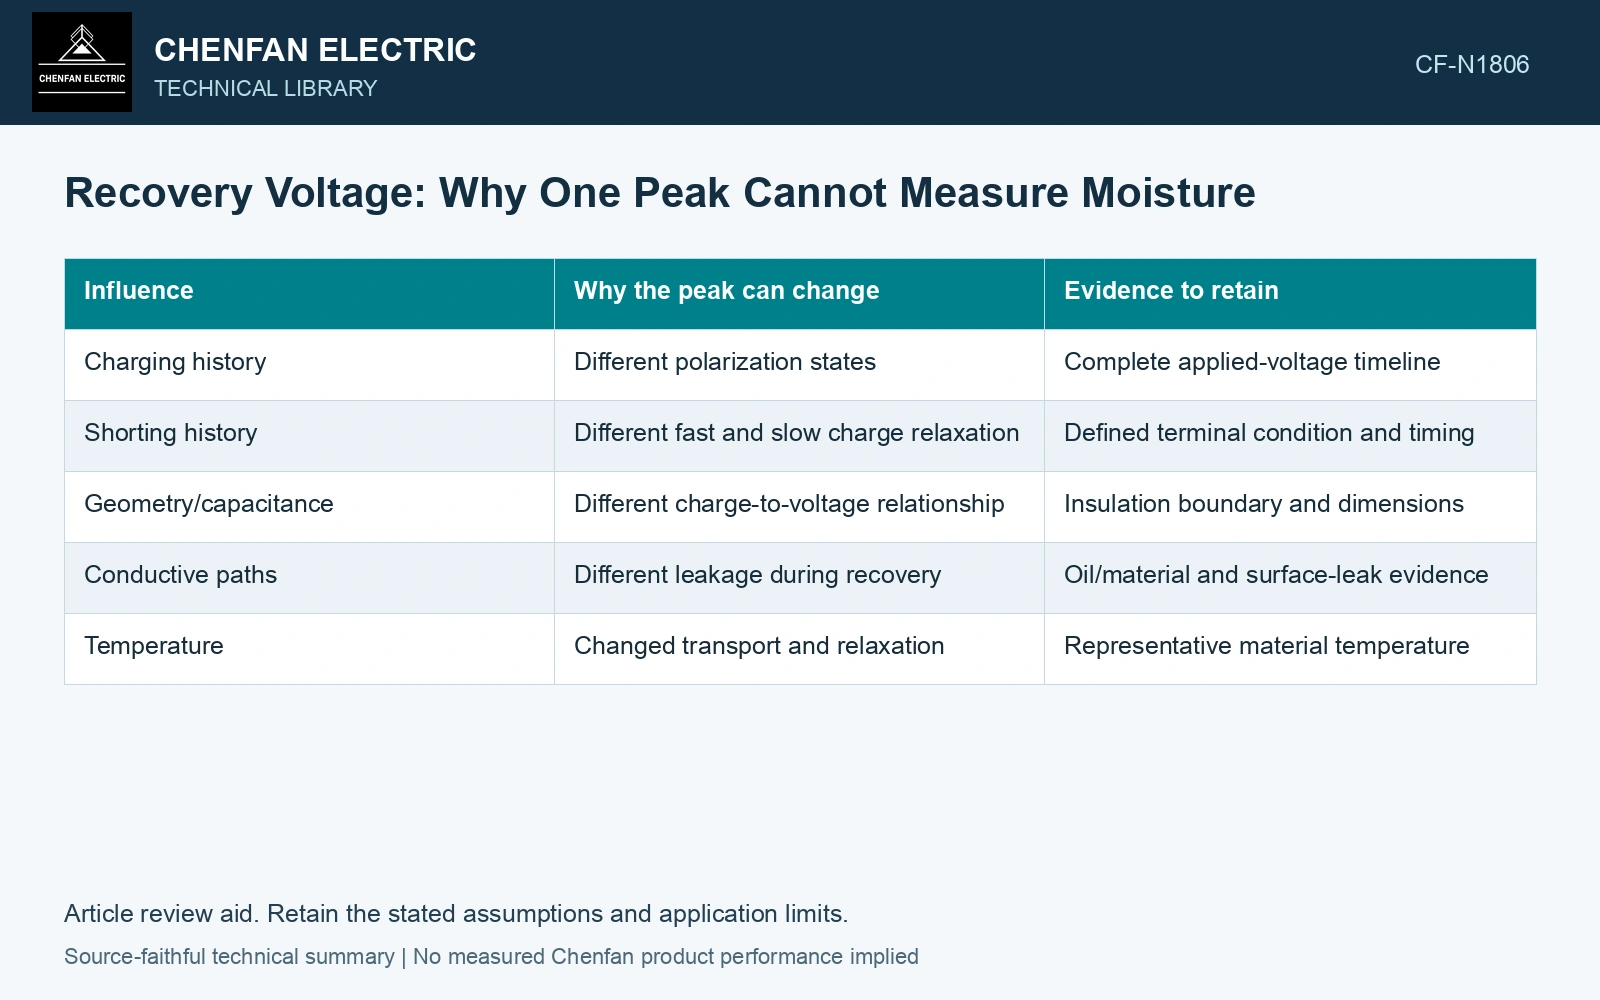
After a defined charging and shorting history, dielectric polarization can produce a recovery voltage when the terminal condition changes. The peak is influenced by that history, capacitance and conductive leakage. It is not a unique paper-moisture reading. [1]
Record charge voltage and duration, shorting condition and duration, the subsequent measuring boundary and temperature. Use the approved instrument procedure; this discussion supplies no switching or discharge sequence.
| Influence | Why the peak can change | Evidence to retain |
|---|---|---|
| Charging history | Different polarization states | Complete applied-voltage timeline |
| Shorting history | Different fast and slow charge relaxation | Defined terminal condition and timing |
| Geometry/capacitance | Different charge-to-voltage relationship | Insulation boundary and dimensions |
| Conductive paths | Different leakage during recovery | Oil/material and surface-leak evidence |
| Temperature | Changed transport and relaxation | Representative material temperature |
A circuit example shows the ambiguity
In a lumped representation, retained charge q on capacitance C produces voltage q/C. Charge is coulombs and capacitance farads, giving volts. The same voltage can result from different q and C. Adding leakage and several relaxation branches broadens the ambiguity further.
Peak time also reflects the selected history and network. A fitted time constant may be useful for comparison under matched conditions, but it cannot be assigned one universal moisture meaning.
The extended Debye circuit places geometric capacitance alongside series RC absorption branches. That structure supports an explicit voltage-recovery model, but its element values require independent geometry/material constraints. [2]
Demonstrate the nonunique recovery peak
Assumptions: after one specified ideal charging/shorting history, terminal C₀ = 1 nF starts at 0 V and a series absorption branch C₁ = 4 nF, R₁ = 1 GΩ starts with C₁ at 10 V; terminal leakage R₀ = 2 GΩ. The state equations are dV/dt = −1.5V + V₁ and dV₁/dt = 0.25V − 0.25V₁, with volts and seconds. Their decay rates are −0.0746095 and −1.6753905 s⁻¹, giving V(t) = 10(e⁻⁰·⁰⁷⁴⁶⁰⁹⁵ᵗ − e⁻¹·⁶⁷⁵³⁹⁰⁵ᵗ)/1.6007811. The actual recovery peak is 5.163 V at 1.944 s. A second model with both capacitances doubled and both resistances halved has exactly the same equations and peak, although retained charge doubles. Reject moisture identification from that peak alone; retain the complete history, geometry and independently supported material model. This calculation prescribes no discharge procedure. [2]
References
- IEEE, IEEE C57.161-2018, IEEE Guide for Dielectric Frequency Response Test.
- J. Raxsa, P. Nimsanong, T. Mai-Eiam and P. Yutthagowith, Determination of Dielectric Models Based on Effective Multi-Exponential Fittings, Energies 16, 4615, 2023. DOI: 10.3390/en16124615.