

Water collected in a drying plant need not arrive at the instant it leaves insulation. Vapour transport, condensation, separation and drainage introduce delay and storage. Apply a recovery-path mass balance before interpreting a collection-vessel rate as the material endpoint. [1]
Model the collector as a separate boundary
A simple mass balance is dMhold/dt = ṁevap − ṁcollect − other quantified routes. Mass is kilograms and rates kg/s. Mhold is water held within the recovery-path boundary; it can grow or empty while the material evaporation rate changes differently. [1]
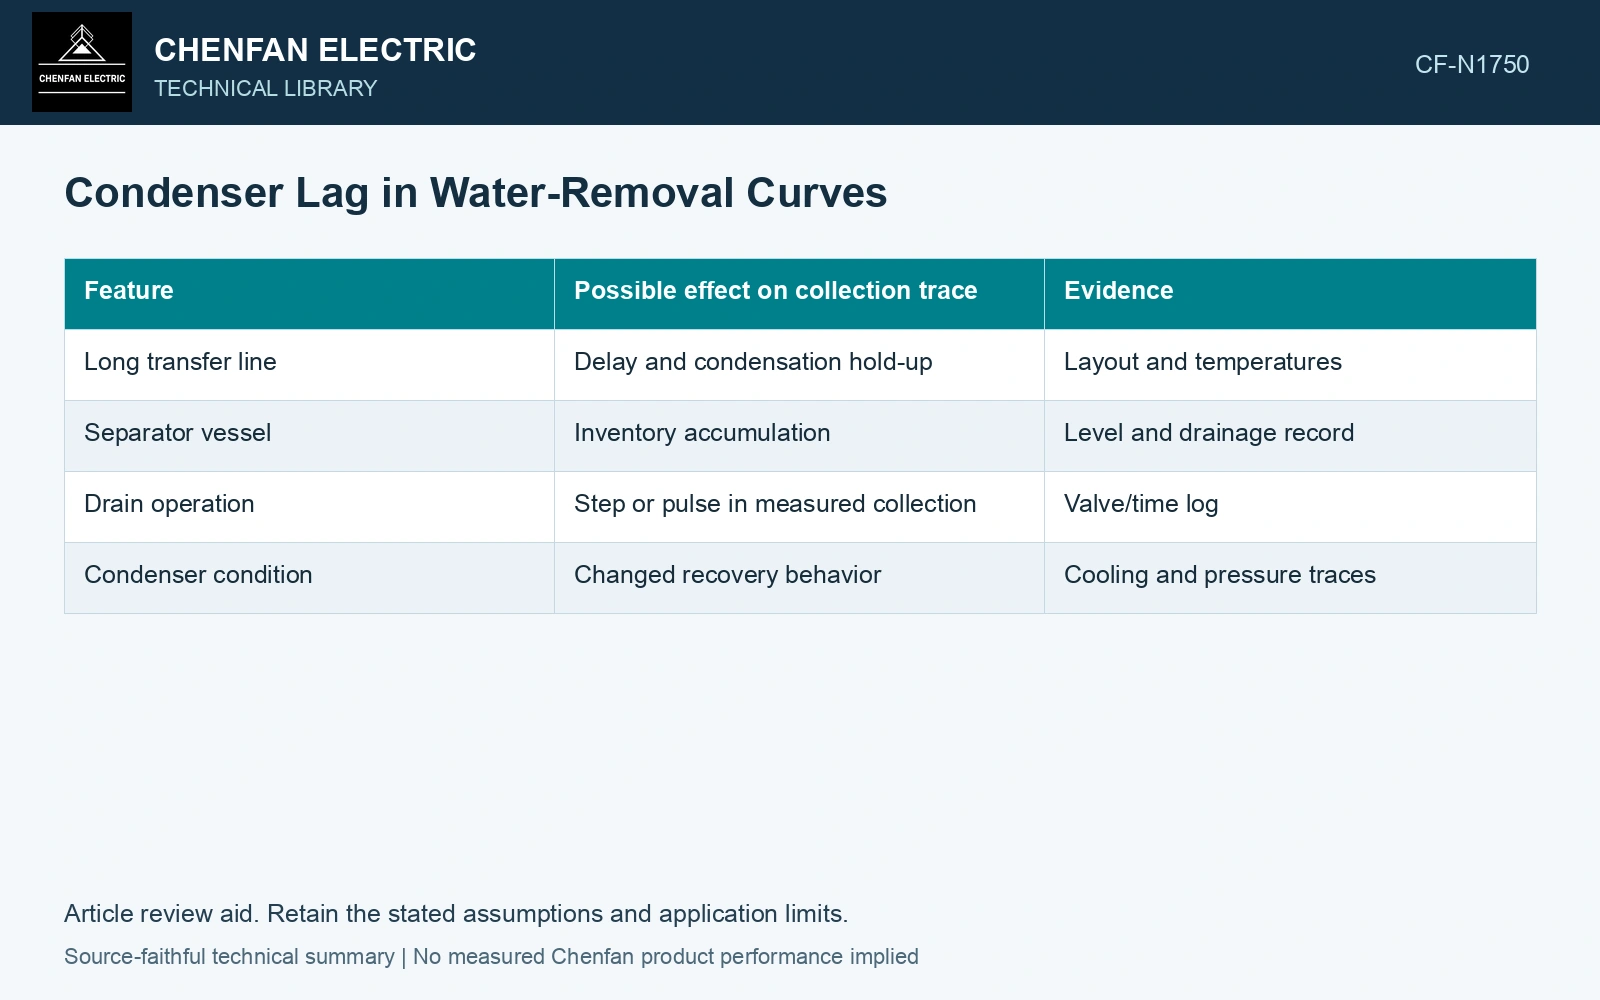
| Feature | Possible effect on collection trace | Evidence |
|---|---|---|
| Long transfer line | Delay and condensation hold-up | Layout and temperatures |
| Separator vessel | Inventory accumulation | Level and drainage record |
| Drain operation | Step or pulse in measured collection | Valve/time log |
| Condenser condition | Changed recovery behavior | Cooling and pressure traces |
Compare cumulative mass as well as rate
Short averaging windows can exaggerate drainage pulses. Plot cumulative collected water with the rate and note whether the reported quantity excludes solvent. Compare it with inventory changes over a sufficiently defined time interval.
Do not use an apparent lag correction to create an unmeasured evaporation curve without identifying the model and uncertainty. Multiple recovery-path behaviors can explain the same collection shape.
A drying model fitted to water extraction and initial paper condition needs a justified relation between its extraction observation and the material state. Changing the recovery boundary can break that relation. [2]
Account for recovery-system inventory
Assumptions: over 10 min, 3 kg water leaves insulation, 2 kg reaches the vessel and recovery-path inventory increases by 1 kg, with no other route. Material removal averages 0.30 kg/min, but the vessel shows 0.20 kg/min. A hypothetical endpoint below 0.25 kg/min would be falsely met by the vessel rate while material removal remains above it. Hold endpoint interpretation until inventories and lag are reconciled; the assumed rate threshold is not a drying specification.
References
- U.S. Department of Energy, DOE-HDBK-1012/3-92, Thermodynamics, Heat Transfer, and Fluid Flow, Volume 3, 1992.
- Y. Brahami, A. Betie, F. Meghnefi, I. Fofana and Z. Yeo, Development of a Comprehensive Model for Drying Optimization and Moisture Management in Power Transformer Manufacturing, Energies 18, 789, 2025. DOI: 10.3390/en18040789.