

A converter transformer may be tested with a controlled sinusoidal current while its service current contains harmonics. The measured load loss is valuable, but translating it into service heating requires an explicit model. Calling a corrected result “measured harmonic loss” blurs that distinction. Apply the HVDC transformer specification framework of IEC/IEEE 60076-57-129 to the stated liquid-immersed equipment [1].
Define the test condition: frequency, winding connection, current, tap and temperature reference. Retain the actual test result and uncertainty separately from any service calculation. Obtain the service spectrum for the defined converter operating cases, including harmonic phase and current allocation among windings.
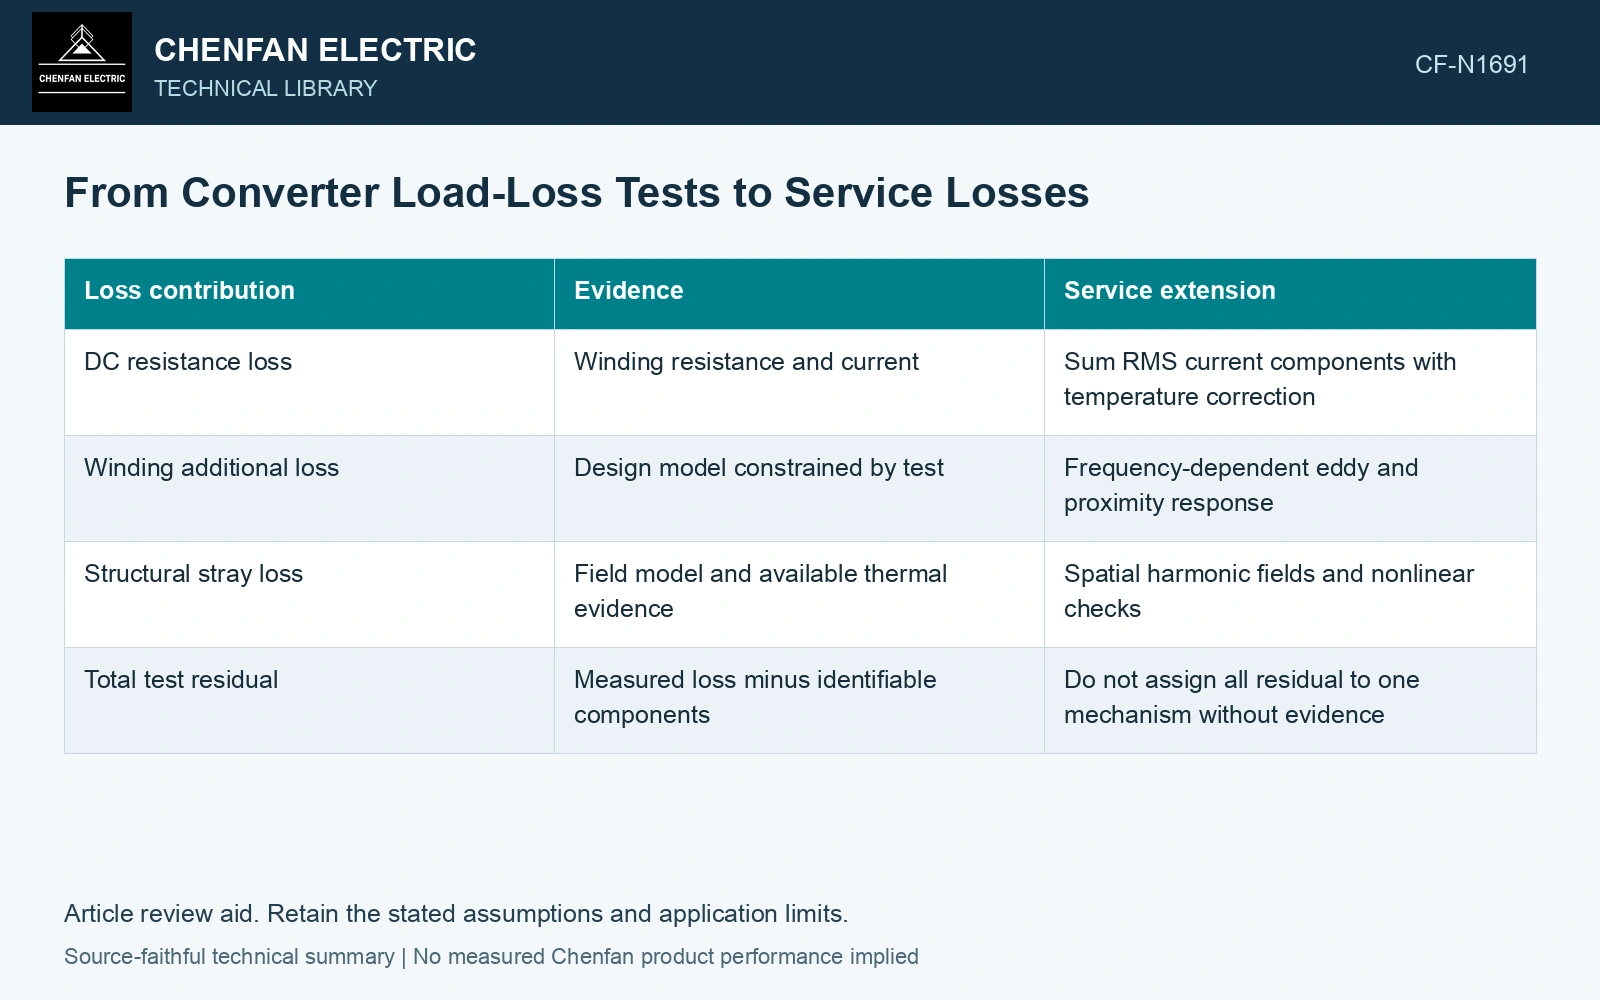
A loss reconciliation ledger
| Loss contribution | Evidence | Service extension |
|---|---|---|
| DC resistance loss | Winding resistance and current | Sum RMS current components with temperature correction |
| Winding additional loss | Design model constrained by test | Frequency-dependent eddy and proximity response |
| Structural stray loss | Field model and available thermal evidence | Spatial harmonic fields and nonlinear checks |
| Total test residual | Measured loss minus identifiable components | Do not assign all residual to one mechanism without evidence |
Apply only the scaling the model supports
For one winding current path with constant DC resistance R, the resistive contribution for orthogonal harmonic currents is RΣIh². Units are ohms and amperes, giving watts. This does not give winding eddy or structural loss. Those components respond to frequency, geometry and magnetic properties.
Some simplified methods use frequency-squared weighting for a limited eddy-loss regime. Such a weighting is an approximation whose applicability needs checking; it is not a universal converter-transformer correction. Skin effect, shielding and local saturation can change the scaling.
Separate an RMS copper increment from additional loss
Assume a winding resistance of 0.020 Ω at a fixed 75 °C and orthogonal RMS currents of 1000 A at 50 Hz, 100 A at 250 Hz and 50 A at 350 Hz. Resistive loss is 0.020 × (1000² + 100² + 50²) = 20.25 kW, versus 20.00 kW for the fundamental alone: an increase of 1.25%. Add that 0.25 kW only to the resistance-loss ledger. It supplies no numerical correction for winding eddy or tank loss; those need the frequency-dependent model and test reconciliation.
Keep a path back to the measurement
Run the model at the original test condition and compare its total and components with the measured baseline. Then change the input to the service waveform. A model unable to reproduce the baseline within stated uncertainty needs explanation before its harmonic correction is treated as design evidence.
Present the measured baseline, calculated increment and final predicted distribution as separate entries. Include the converter case that drives each result. This format allows a reviewer to see what was physically tested and what relies on modelling, without discarding either source of evidence.
Include normal converter operation and converter-side faults in the transformer transient study [2].
References
- IEC/IEEE, IEC/IEEE 60076-57-129:2017, Power transformers – Part 57-129: Transformers for HVDC applications.
- CIGRE WG B4.51, Technical Brochure 609, Study of Converter Transients Imposed on the HVDC Converter Transformers, 2015.