

Short answer
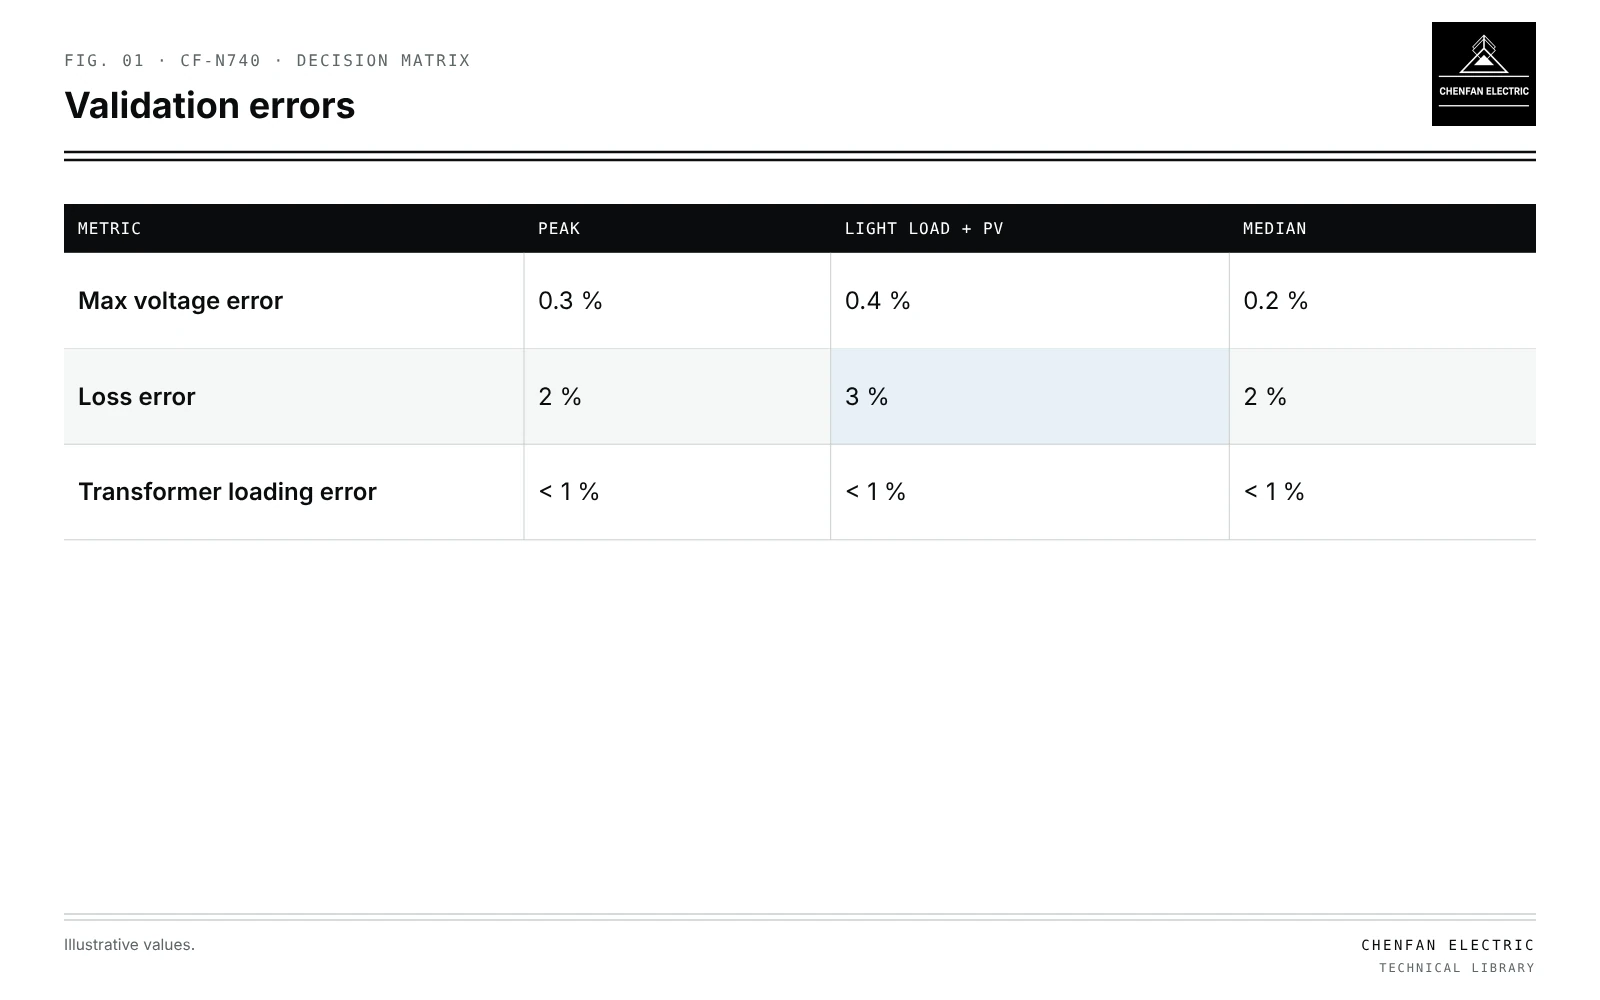
Distribution network model reduction cuts large models down to a manageable size by aggregating loads and line sections, while keeping the nodes that a study needs. Those nodes include the transformers being studied, voltage regulators, capacitor banks, DER connection points, switches used in reconfiguration, and the nodes with extreme voltages, such as feeder ends. In an illustrative case, a 5,000-node feeder model is reduced to 300 nodes; compared with the full model, maximum voltage error is about 0.3 % and total loss error about 2 %. Validation should cover several load states, because an equivalent tuned at peak may misrepresent light-load voltage rise with PV. A model validated only for load flow is not automatically validated for fault currents, grounding paths or protection. Those studies need separately validated equivalents or the full network.
What to keep
| Metric | Peak | Light load + PV | Median |
|---|---|---|---|
| Max voltage error | 0.3 % | 0.4 % | 0.2 % |
| Loss error | 2 % | 3 % | 2 % |
| Transformer loading error | < 1 % | < 1 % | < 1 % |
| Node type | Why |
|---|---|
| Transformers under study | Loading results needed |
| Regulators and capacitors | Control actions |
| DER points | Generation injection and voltage rise |
| Switches and ties | Reconfiguration and restoration; see tie-switch placement |
| Extreme voltage nodes | Compliance limits |
| Measurement points | Calibration |
Everything else can be aggregated, provided the aggregation preserves voltage drop and losses to retained nodes.
Aggregation methods
- Lumping loads along a section to equivalent points preserving drop.
- Combining line segments with equivalent impedance.
- Equivalent laterals represented at their tap point.
- Phase preservation: single-phase laterals must keep their phase; see transformer phase mapping from GIS data.
Validation
Illustrative example. 5,000-node feeder model reduced to 300 nodes; comparison at peak, light load with PV, and median load. Values chosen for demonstration.
| Metric | Peak | Light load with PV | Median |
|---|---|---|---|
| Max voltage error | 0.3 % | 0.4 % | 0.2 % |
| Loss error | 2 % | 3 % | 2 % |
| Transformer loading error | < 1 % | < 1 % | < 1 % |
Errors should be stated with the study’s tolerance. Larger errors at light load warn that the equivalent is less reliable for hosting capacity; see probabilistic hosting capacity.
Time-series use
Reduced models make quasi-static time-series studies feasible; see quasi-static time-series studies. The reduction must hold over the range of loads in the series, not only at the point it was built.
Fault studies
A load-flow reduction may preserve voltage drop without preserving the fault impedances and current paths needed for protection. Unless those quantities were explicitly retained and validated, the load-flow validation alone is insufficient. Protection studies need:
- Exact impedance from source to each protective device.
- Fault current distribution among branches.
- Correct grounding.
Using a load-flow equivalent for fault studies can misstate fault levels and coordination.
Error propagation
Errors in the full model, such as hidden parallel sources, carry into the reduced model; see normally open points without hidden parallel sources. Validate the full model first.
What this article does not cover
Choice between two- and three-dimensional models for transformer cores is a separate topic and is not covered here.
Where this reasoning stops. Error values are illustrative; each reduction needs its own validation.
Practical takeaway
Keep every node a study needs, aggregate the rest with preserved voltage drop and losses, validate across load states, and build separate equivalents for fault and protection studies.