

Short answer
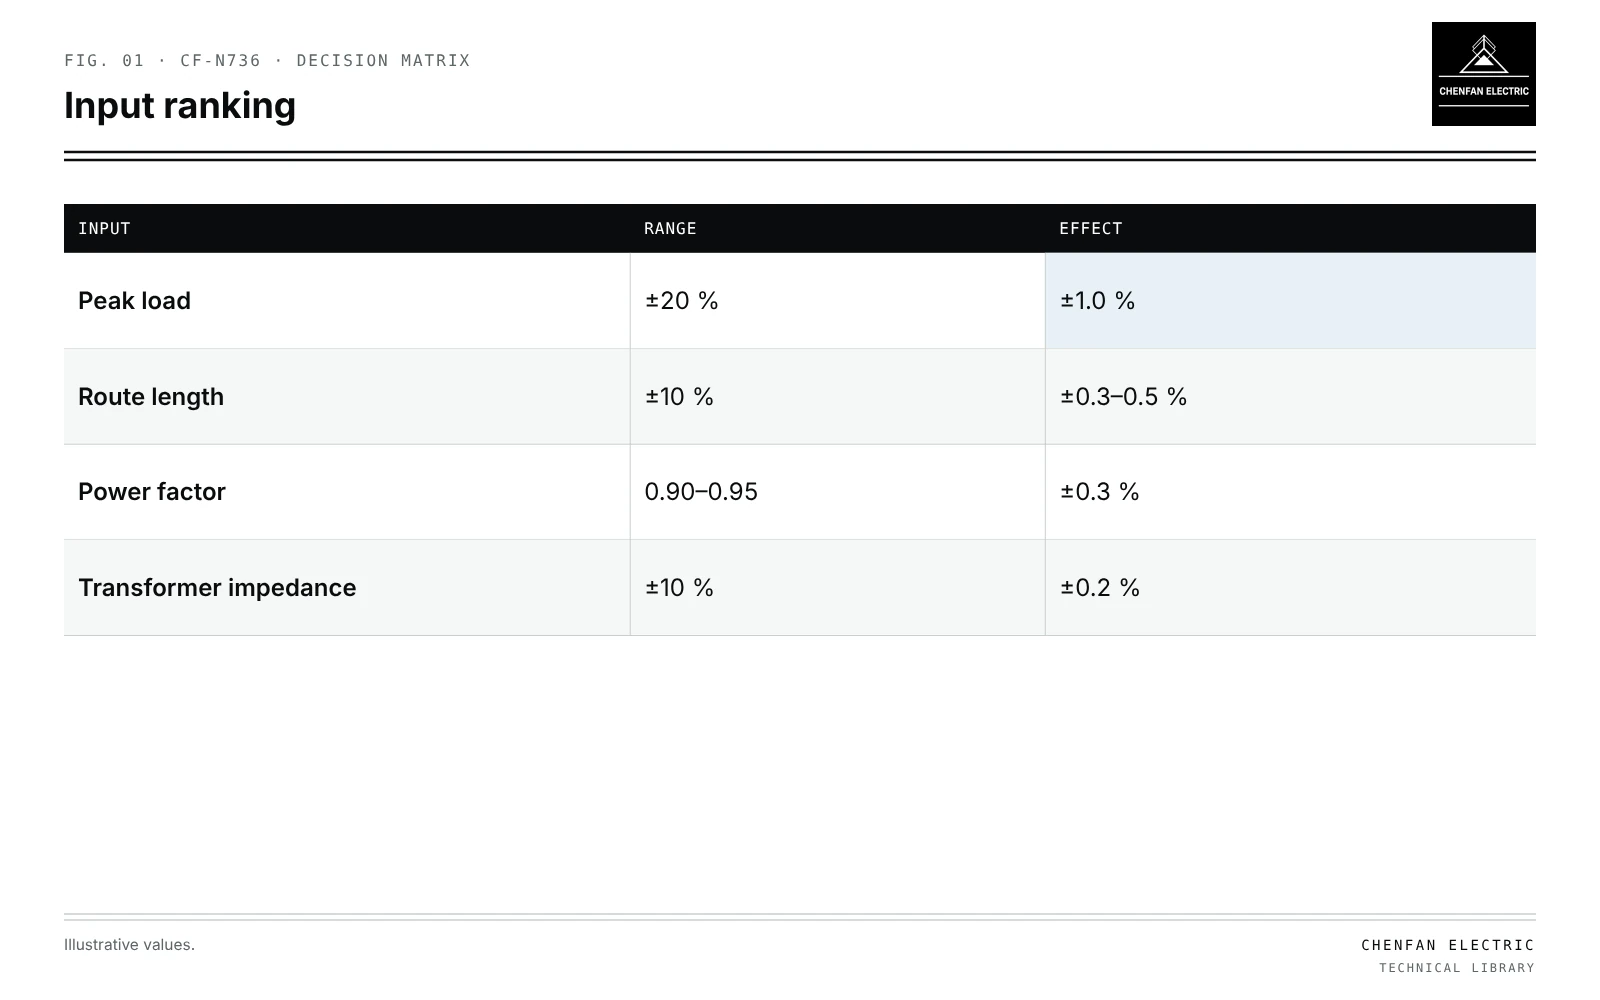
Transformer planning sensitivity ranking asks which inputs, given their realistic uncertainty, change the study result most. Each input is varied over its plausible range while others stay at base values, and the change in the result is recorded. In an illustrative end-of-line voltage study for a distribution transformer and LV feeder, peak load uncertain by ±20 % moves end voltage by about ±1.0 %, cable route length uncertain by ±10 % by ±0.5 %, power factor between 0.90 and 0.95 by about ±0.3 %, and transformer impedance within a ±10 % tolerance by only about ±0.2 %. Load data therefore deserve the most attention, and impedance the least, for this question. Inputs must stay within physical bounds, and correlated inputs varied together. Measurement and data-cleaning effort should follow the ranking rather than be spread evenly.
Method
| Input | Range | Effect |
|---|---|---|
| Peak load | ±20 % | ±1.0 % |
| Route length | ±10 % | ±0.3–0.5 % |
| Power factor | 0.90–0.95 | ±0.3 % |
| Transformer impedance | ±10 % | ±0.2 % |
- Define the result: end voltage, transformer loading, losses or hosting capacity.
- List inputs with realistic ranges from data quality, not arbitrary percentages.
- Vary each across its range; record the change in result.
- Rank by size of change; display as a tornado chart.
- Check interactions for the top inputs, varying them together.
Illustrative ranking
Illustrative example. End-of-line voltage on an LV feeder supplied by a 6 % impedance transformer; base drop 5 %, of which about 2 % in the transformer and 3 % in the cable. Values chosen for demonstration.
| Input | Range | Effect on end voltage |
|---|---|---|
| Peak load | ±20 % | ±1.0 % |
| Cable route length | ±10 % | ±0.3 to ±0.5 % |
| Power factor | 0.90–0.95 | ±0.3 % |
| Transformer impedance | ±10 % | ±0.2 % |
Load affects both transformer and cable drops, which is why it dominates. Transformer impedance tolerance matters little to end voltage, though it matters more for fault levels and parallel operation.
Keeping inputs physical
- Power factor cannot exceed 1.
- Loads cannot be negative unless generation is modelled.
- Correlated inputs: load and power factor often move together; see Monte Carlo load scenarios without impossible combinations.
- Impedance tolerance from the applicable standard and test report, not guessed.
Using the ranking
| Rank | Action |
|---|---|
| High | Measure or calibrate; see calibrating transformer load allocation with AMI data |
| Medium | Verify from records; see transformer phase mapping from GIS data |
| Low | Use justified values within assessed ranges; retain uncertainty |
Different results rank inputs differently: for transformer loss studies, load profile shape and no-load loss values rise in importance; for siting, route length does; see transformer siting and service reach.
What this article does not cover
Sensitivity of core finite-element models to geometry is a separate topic and is not covered here.
Where this reasoning stops. One-at-a-time variation misses interactions; use it as a first ranking.
Practical takeaway
Rank planning inputs by their effect over realistic ranges, keep them physical, and direct measurement and data correction to the top-ranked inputs for each question studied.
Reference framework
- A. Saltelli et al., Global Sensitivity Analysis: The Primer.
- IEC 60076-1, Power transformers: general (impedance tolerances).