

Lock-in thermography extracts the surface response synchronized with a controlled modulation. It can help separate a repeatable thermal signal from background variation. The amplitude and phase still depend on how heat reaches the observed surface, including source depth and the laminated structure.
Define the modulation without assuming that the electrical command is the thermal input. If excitation is modulated, verify the actual magnetic and power response. Changes in background core heating can accompany the local source being investigated.
Select frequencies to test a hypothesis
For a homogeneous, semi-infinite material under sinusoidal heating, a useful diffusion-length illustration is delta = sqrt(2 alpha/omega). Alpha is thermal diffusivity in square metres per second, omega is angular modulation frequency in inverse seconds, and delta is in metres.
The expression shows why lower modulation frequency can involve a longer thermal length scale. It does not directly give defect depth in a layered core. Interlayer contact, coatings, directional conductivity and finite boundaries can alter the response.
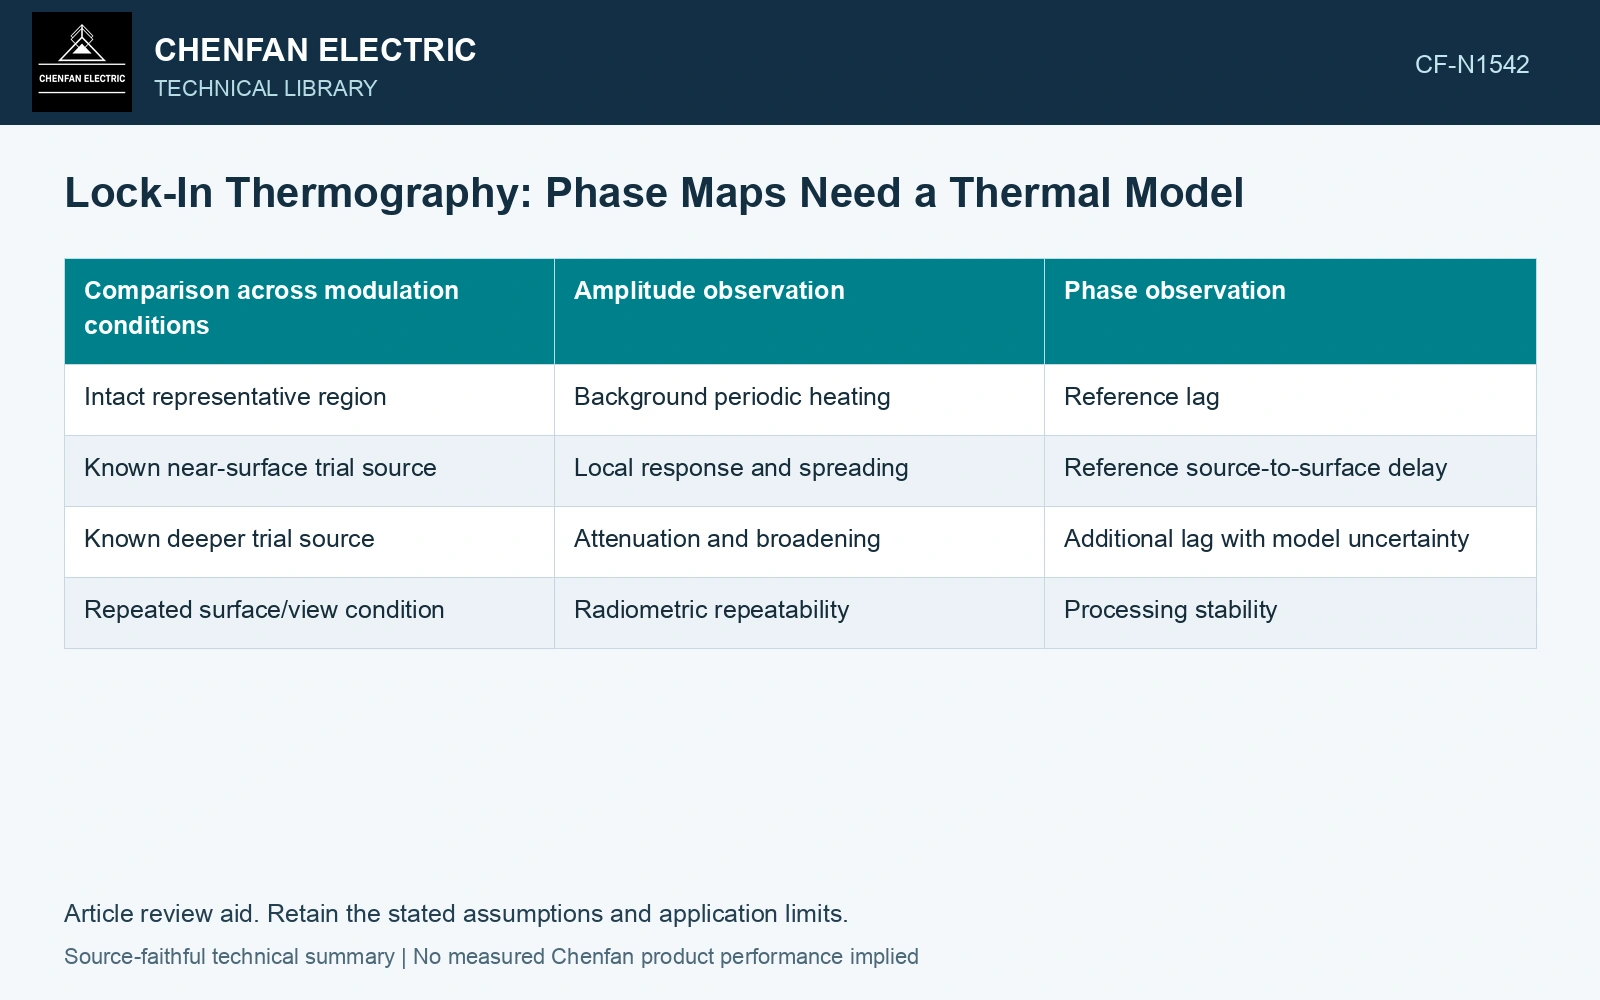
| Comparison across modulation conditions | Amplitude observation | Phase observation |
|---|---|---|
| Intact representative region | Background periodic heating | Reference lag |
| Known near-surface trial source | Local response and spreading | Reference source-to-surface delay |
| Known deeper trial source | Attenuation and broadening | Additional lag with model uncertainty |
| Repeated surface/view condition | Radiometric repeatability | Processing stability |
Use known references to establish what the method can distinguish. A visually clear phase feature is not enough to identify its depth or cause.
Retain amplitude and phase together
A phase result becomes unreliable where the synchronized amplitude is too small relative to noise. Mark those regions rather than assigning precise phase to every pixel. Record the reference phase, number of cycles, acquisition timing and processing settings.
Surface emissivity and reflected radiation can affect the observed signal. NIST distinguishes radiance temperature from physical surface temperature and describes the role of directional effective emissivity [1]. A periodic reflection can also become synchronized with a test environment, so phase processing does not remove every radiometric artifact automatically.
Validate spatial resolution in the actual stack
Compare accessible surface response with representative source positions and independent knowledge of their geometry. A buried source may produce a broad surface pattern whose maximum does not coincide exactly with its internal position. Specify the demonstrated location accuracy and inaccessible regions.
Evaluate whether several frequency responses discriminate source depth and strength or whether competing sources produce similar data. If the interpretation remains nonunique, retain it as a detected thermal anomaly rather than a layer-specific fault diagnosis.
Compare amplitude and phase across the modulation frequencies, with the noise floor and reference attached. A candidate feature becomes interpretable only where that response is consistent with the thermal model and the demonstrated spatial resolution.
Compare modulation length with a counted layer depth
For nominal 0.23 mm sheets [2], assume a heat source lies 20 sheet thicknesses below the observed face: steel-only depth z = 4.60 mm. For sensitivity only, assume homogeneous α = 1.0 × 10⁻⁶ m²/s. Diffusion length δ = √[α/(πf)] is 1.784 mm at 0.10 Hz and 0.564 mm at 1.0 Hz. In the semi-infinite planar-source model, attenuation exp(−z/δ) is 0.0759 and 0.000288 respectively. The higher frequency may leave too little amplitude for useful phase. Test lower modulation frequencies against drift and acquisition time, then validate laminated thermal boundaries and signal uncertainty [3] [1] before inferring depth.
Manufacturing controls. Coating, cross-stack contact pressure, duct spacing, source geometry and surface cooling determine actual amplitude and phase. A homogeneous diffusion calculation chooses trial conditions; it does not identify a shorted layer in an unvalidated stack.
References
- Deisenroth, D. C. et al., Measurement Uncertainty of Surface Temperature Distributions for Laser Powder Bed Fusion Processes, Journal of Research of NIST 126, 126013, 2021, sections 1.5 and 2.1; DOI: 10.6028/jres.126.013.
- Nippon Steel Corporation, Grain-Oriented Electrical Steel Sheets, catalogue D004je_03_202004, 2020, Specifications; Size and Form Tolerances.
- JCGM, JCGM 100:2008, Evaluation of measurement data — Guide to the expression of uncertainty in measurement, 2008.