

The fault has cleared, but the transformer-fed bus voltage recovers slowly. A static sag duration does not explain why. Some motors may have slowed into a high-current state, keeping the source loaded while protection and contactors decide which loads remain connected. [1]
The investigation needs the post-fault trajectory. Separate a continuing source limitation from a load-driven recovery problem, then assess their interaction.
Follow the feedback after clearing
Low voltage can reduce induction-motor accelerating torque. A stalled or slowly accelerating motor can draw substantial current and reactive power. Through the source impedance, that demand can sustain voltage depression and prevent recovery. The loop can persist until loads accelerate, disconnect or another system action changes the state.
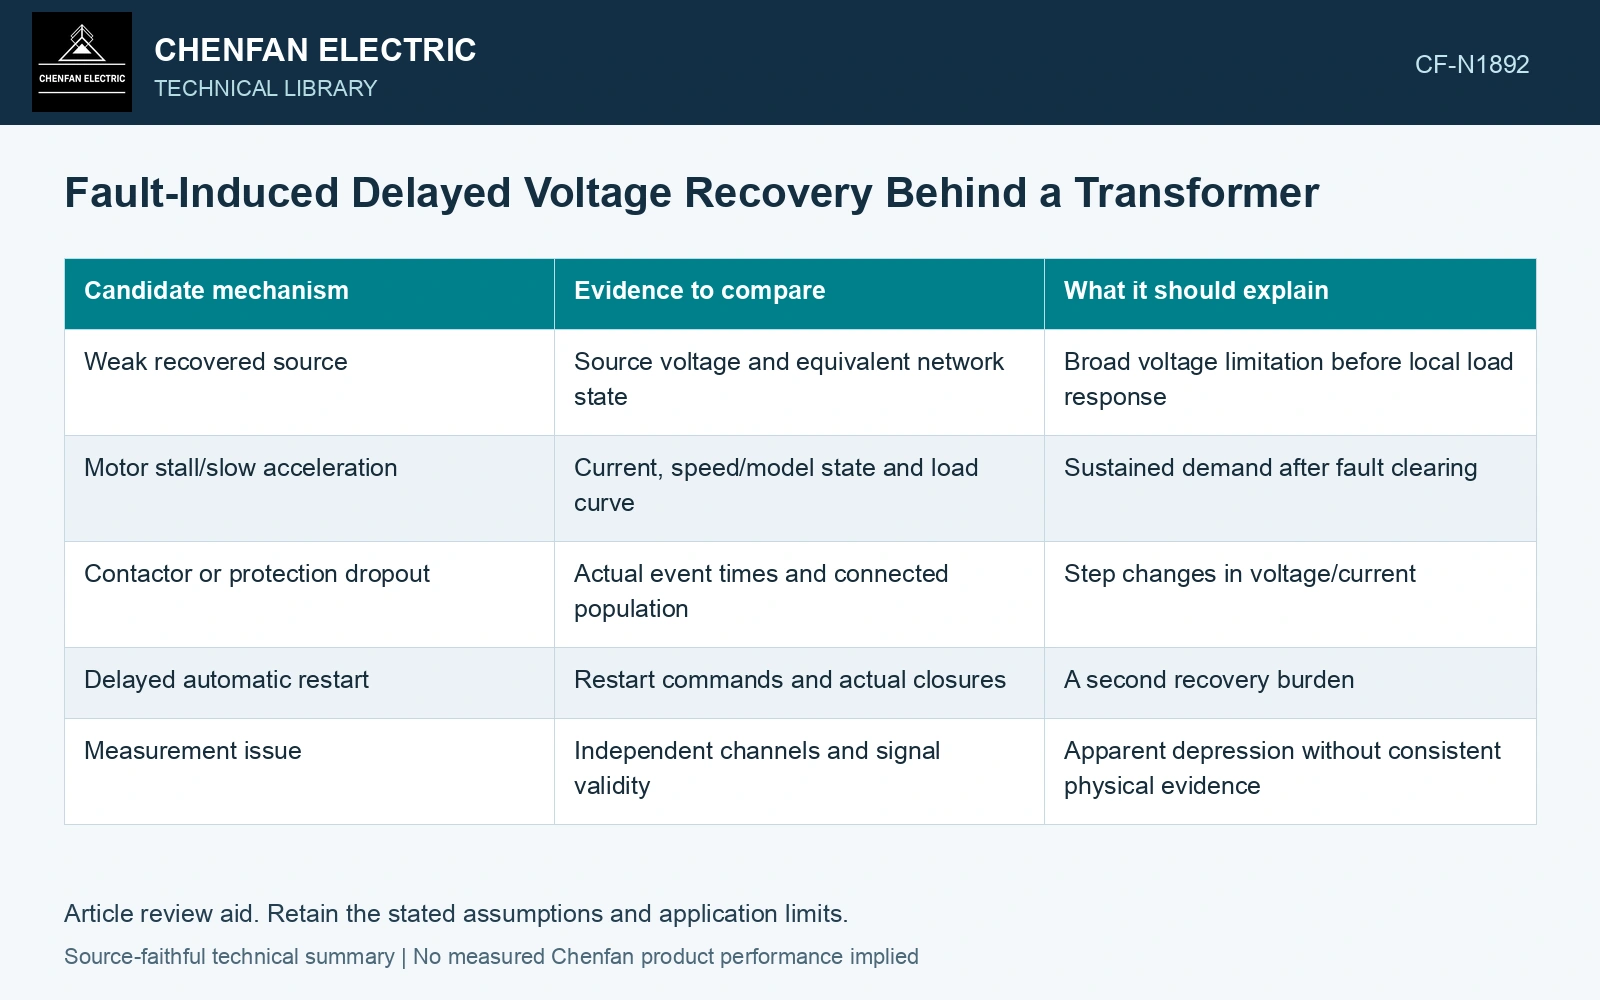
| Candidate mechanism | Evidence to compare | What it should explain |
|---|---|---|
| Weak recovered source | Source voltage and equivalent network state | Broad voltage limitation before local load response |
| Motor stall/slow acceleration | Current, speed/model state and load curve | Sustained demand after fault clearing |
| Contactor or protection dropout | Actual event times and connected population | Step changes in voltage/current |
| Delayed automatic restart | Restart commands and actual closures | A second recovery burden |
| Measurement issue | Independent channels and signal validity | Apparent depression without consistent physical evidence |
A voltage-only record can reveal the symptom but may not distinguish these mechanisms. Retain current, source and switching information on the same time base where available.
Preserve machine diversity
Not every motor stalls at the same condition or time. Different inertia, torque load, magnetic state and protection can create a changing mixture. An aggregate model needs validation against the quantities governing recovery.
A disconnected motor should be removed from the corresponding network. A protection event can improve voltage while creating a process interruption; the electrical and process outcomes are separate findings.
Model the recovery horizon
Extend the dynamic simulation beyond the clearing instant and initial reconnection. Include relevant protection and thermal events through the period in which the bus reaches its accepted state or fails to do so. A short simulation can display a promising rise that is followed by a renewed depression.
The SEL transfer paper’s dynamic modeling and waveform replay are relevant methods for testing such evolving signals. Its single-motor refinery case does not establish the mechanism or duration of delayed recovery at another site.
Positive- and negative-sequence machine states and the network need a coupled transient treatment when voltage becomes unbalanced. [2]
Compare current duration after clearing
Assume one recovery trajectory draws 2 pu RMS current for 5 s and another 3 pu for 2 s, using the same current base. Their constant-resistance heating indices are 20 and 18 pu²s respectively. The lower-current trajectory has the larger index; compare its sustained voltage and motor acceleration as well as its peak current.
References
- P. Muralimanohar, D. Haas, J. R. McClanahan, R. T. Jagaduri and S. Singletary, Implementation of a Microprocessor-Based Motor Bus Transfer Scheme, IEEE PCIC, 2016, DOI: 10.1109/PCICON.2016.7589248.
- W.-P. Liao, Y. Zhang and R. Zhou, Analytical method to calculate transient responses of induction motor load, IET Generation, Transmission & Distribution, 2020, DOI: 10.1049/iet-gtd.2018.6107.