

Two reactor core faces can have the correct average separation and still form a wedge. The narrow side attracts more flux in a simple gap-dominated picture and can experience greater magnetic pressure. That local load may increase tilt if the support is flexible. [1]
Measure gap length at several defined positions across the face under assembly preload. Report minimum, maximum and orientation of the gradient. A single central feeler reading does not characterize nonparallelism.
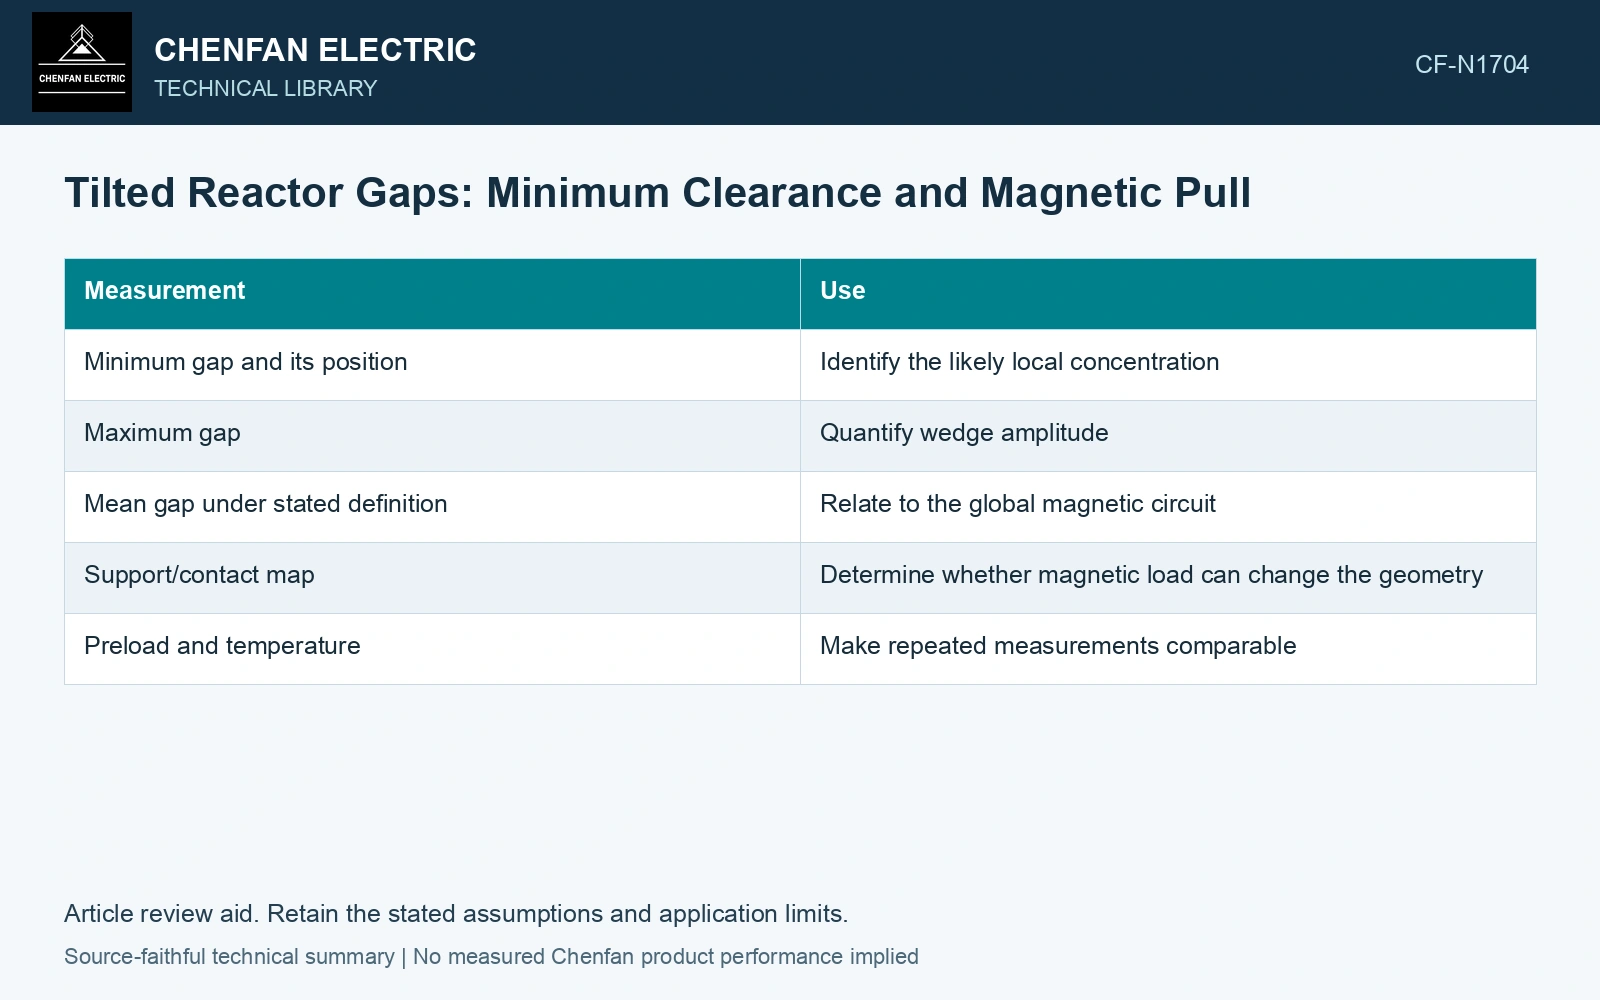
Describe the wedge before solving the field
| Measurement | Use |
|---|---|
| Minimum gap and its position | Identify the likely local concentration |
| Maximum gap | Quantify wedge amplitude |
| Mean gap under stated definition | Relate to the global magnetic circuit |
| Support/contact map | Determine whether magnetic load can change the geometry |
| Preload and temperature | Make repeated measurements comparable |
A local screening relation
If a uniform magnetomotive force F acts across independent, linear gap paths, B(x) ≈ μ₀F/g(x). Magnetic pressure is approximately p(x) = B(x)²/(2μ₀). Here F is magnetomotive force in ampere-turns, g(x) is local gap length in metres and μ₀ is free-space permeability in H/m. With B in teslas, p is in pascals. This predicts a strong increase near the narrow side.
The independent-path picture omits lateral flux redistribution, fringing and saturation. It should identify where a detailed field model is needed, not set a permitted tilt. The global magnetic circuit can alter F as the geometry changes.
Report uncertainty at the narrow edge, not only the mean gap. A chosen uncertainty decision bound maps through the nonlinear local-field model and can change the pressure screening margin. [2]
Screen a tilted gap’s local pressure ratio
Assumptions: at 50 Hz peak magnetic excitation, a uniform 2.0 mm gap would carry 0.80 T; its magnetic potential drop remains fixed in this local model. A measured narrow edge of 1.50 mm gives 1.067 T and 452.7 kPa, versus 254.6 kPa at 2.0 mm: 1.778 times the pressure. If edge-gap standard uncertainty is 0.05 mm, an assumed k = 2 lower-gap decision bound is 1.40 mm, giving 519.7 kPa. Both exceed an assumed 400 kPa local-pressure ceiling. Hold the tilted geometry and solve the actual fringing/saturation/support equilibrium; this independent-path screen does not set a permitted tilt. [1] [2]
References
- H. B. Duc, T. P. Minh, T. P. Anh and V. D. Quoc, A Novel Approach for the Modeling of Electromagnetic Forces in Air-Gap Shunt Reactors, Engineering, Technology & Applied Science Research 12, 8223–8227, 2022. DOI: 10.48084/etasr.4692.
- B. N. Taylor and C. E. Kuyatt, NIST Technical Note 1297, Guidelines for Evaluating and Expressing the Uncertainty of NIST Measurement Results, 1994, sections 5 and 6.