

Transformerwood impregnation follows the surfaces actually exposed to oil. Map entry paths through the veneer construction and assembly contacts to qualify the thick regions and features of the finished part. [1]
Calculation basis. Project-specific values and gates in the illustrative screens below are assumptions; cited catalogue values retain their source test conditions.
Record the manufacturer’s layup and densification designation. Nominal oil-absorption data for a particular grade demonstrate uptake under its stated test method; they do not establish how quickly oil reaches every region of a machined part.
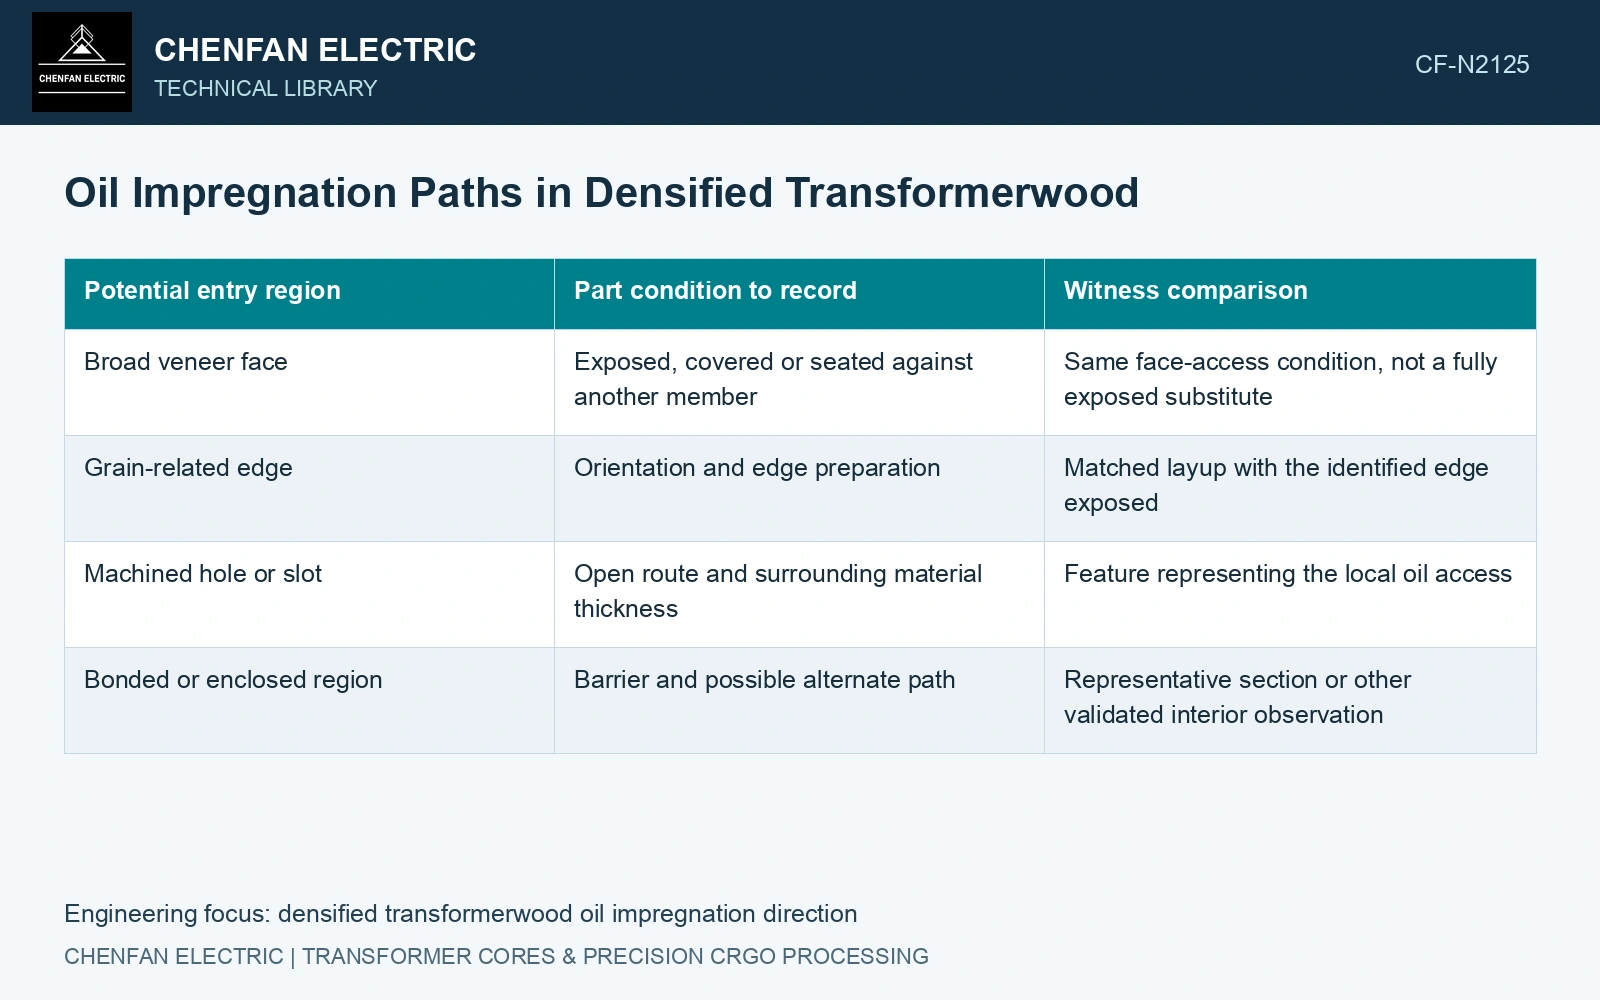
Map access before comparing mass gain
| Potential entry region | Part condition to record | Witness comparison |
|---|---|---|
| Broad veneer face | Exposed, covered or seated against another member | Same face-access condition, not a fully exposed substitute |
| Grain-related edge | Orientation and edge preparation | Matched layup with the identified edge exposed |
| Machined hole or slot | Open route and surrounding material thickness | Feature representing the local oil access |
| Bonded or enclosed region | Barrier and possible alternate path | Representative section or other validated interior observation |
This map defines comparisons; it does not prescribe a ranking of impregnation rates. Resin distribution, veneers and processing can change the route. Determine the relevant behaviour with the actual material rather than assuming the paper capillary model applies unchanged.
What the scale measures
Define the initial mass state and the method used to remove external oil before each later weighing. Keep the handling interval and temperature consistent. Fixtures, retained surface films and moisture changes can contribute to the reading.
In an illustrative example, a specimen changes from 1000 to 1230 g, giving an apparent gain of 23%. If 10 g is independently identified as fixture carryover, correcting that contribution gives 22%. The corrected number still cannot be labelled complete internal oil fill if surface oil or moisture change remains unresolved.
Use time-dependent mass observations together with a validated way to examine the regions that matter. A plateau in total mass may indicate little further change in that measurement; it does not prove that every enclosed volume has reached the intended state.
Compare layups using equivalent exposed areas, dimensions and initial conditions. Otherwise a larger exposed edge or a thinner witness can make one orientation appear faster for reasons unrelated to the veneer arrangement itself.
Inspect dimensions and bond condition after the intended route. Material uptake and an acceptable final fit are different results. A freely exposed specimen can show satisfactory mass behaviour while a restrained part develops a different dimensional response.
Use the entry map to place witnesses at thick closed regions, covered faces and deep features. Retain tested layup and access conditions with the process and purchase evidence.
Correct uptake without claiming complete impregnation
Match the material identity and relevant test direction before comparing densified-wood evidence [2].
For the assumed 1,000 g initial specimen and 1,230 g final weighing, apparent uptake is 23%. Subtracting 10 g fixture carryover gives 22%. An additional assumed 15 g surface-liquid contribution would reduce corrected internal gain to 20.5%. Assume no other mass change for that 20.5% corrected gain. The named datasheet lists 25% oil absorption as an average under its material-test basis [1]. Although 20.5/25 = 82%, that ratio is not an internal-fill fraction: specimen state and accessible regions differ. Examine penetration in the actual thick or enclosed regions before approving the process.
References
- Röchling Industrial, Lignostone L I/2-E3-HQ (P2R), Technical Data Sheet, version 2.0, released 20 September 2023.
- IEC, IEC 61061-2:1992, Specification for non-impregnated, densified laminated wood for electrical purposes — Part 2: Methods of test.