

Strainer deposits and reduced cooling-water flow require separate diagnoses. Transformer maintenance guidance identifies sludge and debris in oil-water cooler tubes [1]. A strainer sample can help locate that material, but appearance alone cannot distinguish biological growth, mineral scale and transported corrosion products.
Retain strainer inlet/outlet pressure, flow and temperature. Pressure drop changes with flow even at unchanged deposit condition. Compare trends at similar flow or use the appropriate clean-strainer relationship before declaring a seasonal fouling increase.
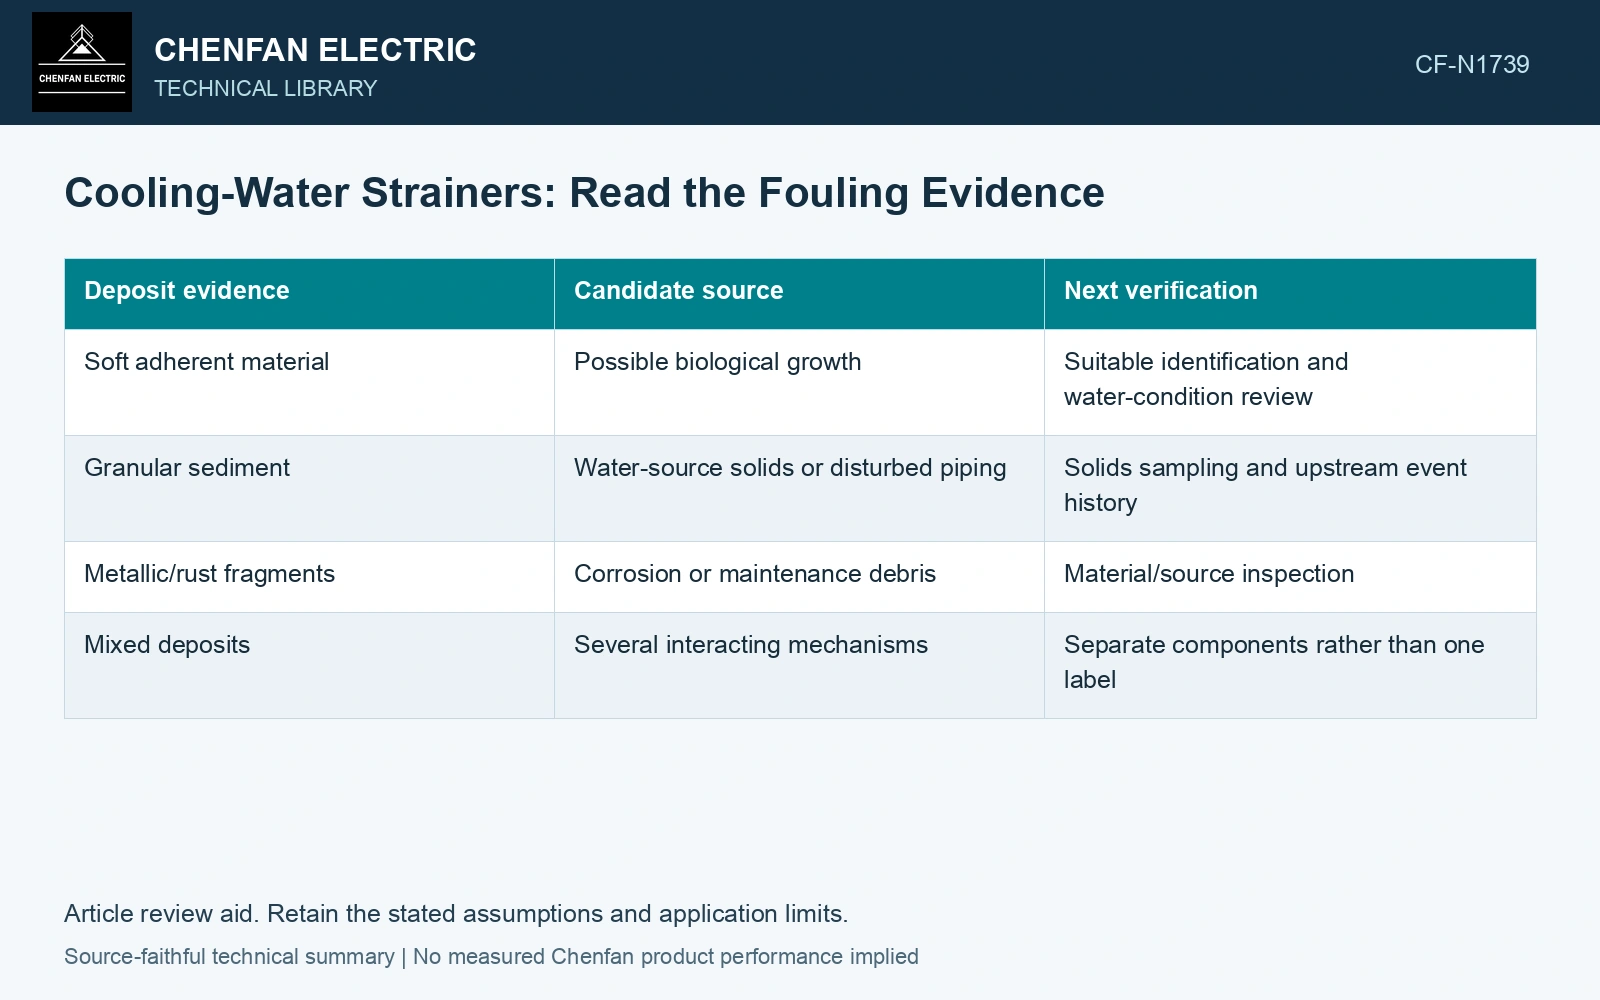
| Deposit evidence | Candidate source | Next verification |
|---|---|---|
| Soft adherent material | Possible biological growth | Suitable identification and water-condition review |
| Granular sediment | Water-source solids or disturbed piping | Solids sampling and upstream event history |
| Metallic/rust fragments | Corrosion or maintenance debris | Material/source inspection |
| Mixed deposits | Several interacting mechanisms | Separate components rather than one label |
Use cleaning as a diagnostic comparison
Under the approved maintenance method, record the deposit and the pressure-flow response before and after cleaning. If resistance remains high, investigate the strainer, another restriction or measurement error. A lower differential pressure at lower flow is not proof of successful restoration.
Keep the water treatment and environmental constraints with any biological-control proposal. Chemical measures require compatibility with metals, seals and discharge obligations. This article provides a diagnostic record, not a dosing instruction.
Compare pressure loss at a matched flow and fluid temperature. For a quadratic resistance screen, define K = Δp/Q²; changing Q changes pressure loss even when the obstruction remains. [2]
A corrosion assessment also needs connected metals, water chemistry and deposits; rust colour alone does not establish the initiating mechanism. [3]
Normalize a restriction comparison to flow
Assume strainer differential pressure is 40 kPa at 10 L/s before cleaning and 20 kPa at 5 L/s afterward. For an illustrative quadratic resistance model, Δp/Q² rises from 0.40 to 0.80 kPa/(L/s)². The lower measured pressure therefore does not establish lower resistance. Compare matched flow and deposit evidence before declaring restoration.
References
- U.S. Bureau of Reclamation, FIST Volume 3-30, Transformer Maintenance, 2000.
- U.S. Department of Energy, DOE-HDBK-1012/3-92, Thermodynamics, Heat Transfer, and Fluid Flow, Volume 3, 1992.
- U.S. Department of Energy, DOE-HDBK-1015/1-93, Chemistry, Volume 1, 1993, Corrosion: Crud and Galvanic Corrosion; Specialized Corrosion.